

- Mantle is struggling to stay above key levels and may see a strong drop soon.
- A bearish pattern is forming and could push prices down if support breaks.
- If MNT fails to recover, traders should prepare for a steep decline ahead.
Mantle (MNT) is at a critical juncture, with technical indicators flashing warning signs of a steep decline. Analyst Ali (@ali_charts) has identified a double-top pattern forming on MNT’s weekly chart, a structure that historically precedes significant downturns. If confirmed, this could push MNT to $0.53, marking a sharp correction from its current level of $1.0274.
MNT Struggles at Resistance After 70% Surge
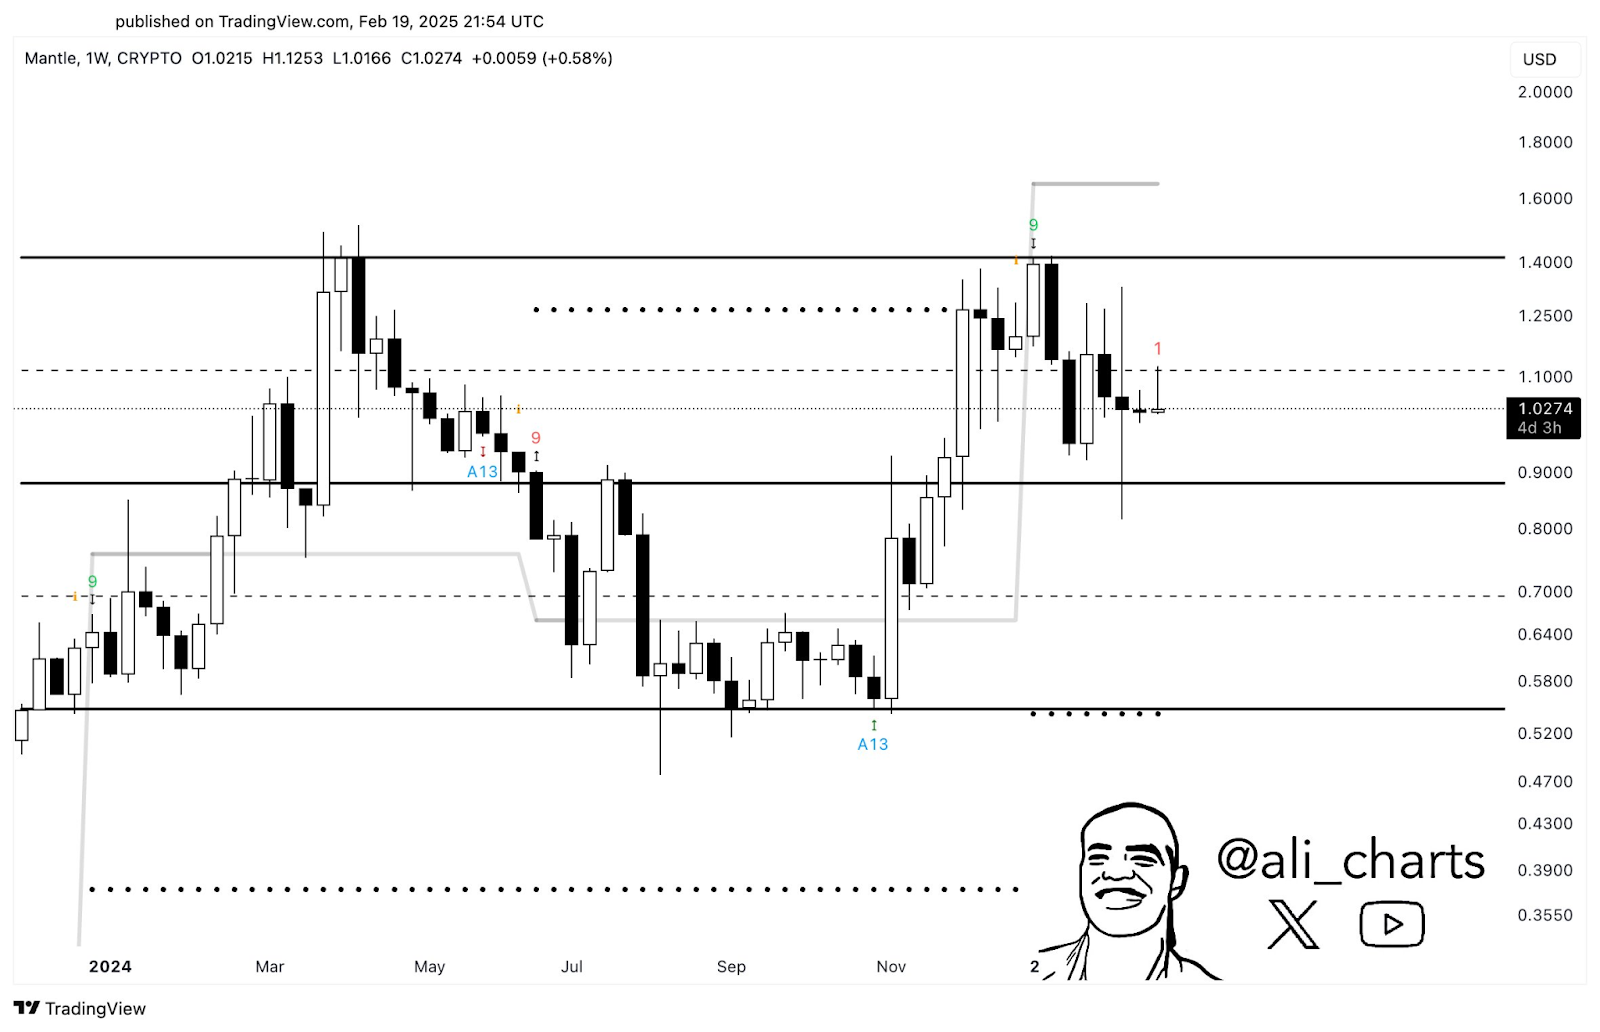
Mantle has shown remarkable price action over the past year, rallying from early 2024 lows near $0.50 to a peak above $1.60. The explosive growth came amid increasing investor interest, but recent price movements suggest exhaustion. The weekly chart displays strong resistance around the $1.40-$1.60 range, where MNT faced multiple rejections. A notable peak occurred when the token touched $1.60 but failed to hold above the level, forming the first leg of the double-top pattern.
The current price of MNT is about $1.0274, with a high this week of $1.1253 and a low of $1.0166. The price action is in a consolidation zone around important horizontal levels, a signal of indecision being all-over. However, if MNT fails to reclaim the $1.10-$1.20 zone, the bears could take over and cause a rapid drop.
Double-Top Formation and Key Breakdown Levels
The double-top pattern, a bearish reversal signal, is defined by two failed attempts to break higher, followed by a drop below the neckline. In MNT’s case, the neckline appears to be around the $0.90 level, a crucial support zone that has held firm in previous corrections. If this level breaks, historical price action suggests a measured move targeting $0.53—aligning with the lower support range marked in the chart.
Adding to the bearish case, MNT recently printed a “1” on the TD Sequential indicator after reaching a “9” at the peak. This signal often precedes trend exhaustion, indicating a shift in momentum. The last time MNT showed similar signals, it suffered a deep pullback, reinforcing the possibility of another correction ahead.
What’s Next for MNT?
The bears are still in charge of short-term action, but there remains a fighting chance for the bulls. If MNT pushes past the $1.20 level and holds above $1.40, it could negate the double-top scenario and allow for another shot at all-time highs. Nevertheless, with the current price action indicating weakness, the odds favor a breakdown.
Over the next few weeks, MNT will be testing support zones and will be decisive for the outlook. In case the bearish scenario plays out, a drop to $0.53 would mean a 48% setback from current levels. Traders and investors should be watching the key resistance at $1.20 and the neckline support zone around $0.90 to better assess the next major move for the token.