
- Litecoin’s historical cycles show accumulation phases followed by major breakouts, with a potential upside target of $600-$800.
- LTC faces key resistance at $137.32; breaking above this level could push the price toward $150 and $165 in the short term.
- The MACD crossover and Bollinger Band expansion signal strong bullish momentum, but failure to hold $115 support may lead to $94.46.
Litecoin (LTC) has followed a repeating price pattern over the years, showing distinct market cycles. According to analyst Javon Marks, the current market pattern resembles its past bull runs.
The price has consistently moved through three key phases: a descending trend, an accumulation period, and a strong breakout. These cycles were evident in 2015-2017 and 2018-2021, leading to substantial rallies.
During the first cycle from 2015 to 2017, LTC consolidated between $2 and $5 before surging past $300. A similar pattern formed in the second cycle between 2018 and 2021, with accumulation between $40 and $60, followed by a peak above $400.
Currently, Litecoin has completed an accumulation phase between $50 and $100 and has begun its breakout, reaching $112. If history repeats, the projected upside could range between $600 and $800.
Price Action and Resistance Levels
At press time, Litecoin was trading at $131.61, a 1.68% decline in the past 24 hours. The price range has a high of $137.50 and a low of $131.02. The resistance level is at $137.32, aligning with the upper Bollinger Band.
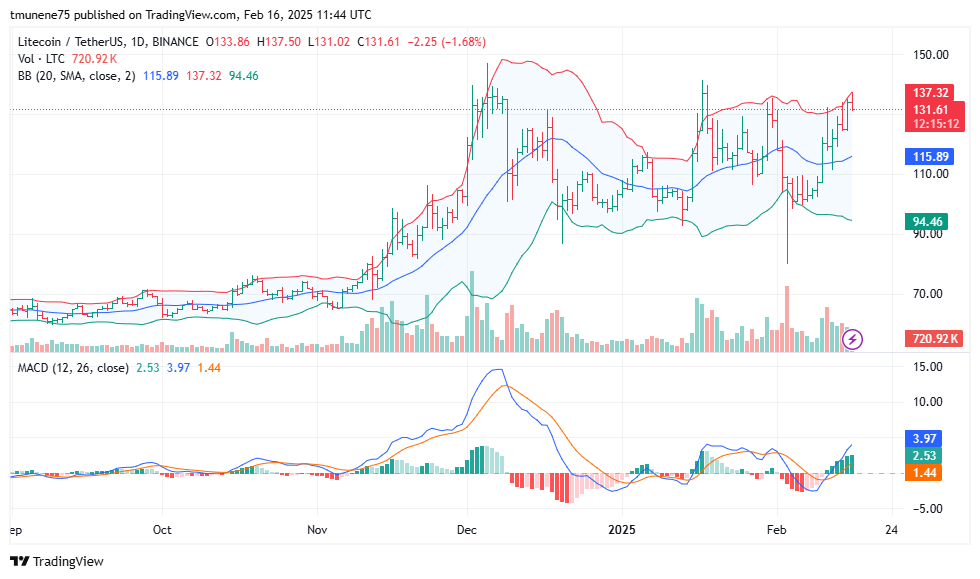
If LTC surpasses this resistance, it could aim for the next targets at $150 and $165. Support levels are at $115.89, which corresponds to the middle Bollinger Band, and $94.46, which the lower Bollinger Band.
These levels indicate potential areas where LTC could find support if a pullback occurs. Volume is currently at 720.92K, showing moderate trading activity. A rise in volume near resistance could suggest an imminent breakout attempt.
Technical Indicators Show Bullish Momentum
The Bollinger Bands show volatility expansion, with Litecoin approaching the upper band. This suggests strong buying pressure but also indicates an overbought condition. If the price holds above the middle band at $115.89, bullish momentum could continue.
The MACD indicator further supports a bullish outlook. The MACD line is at 2.53, while the signal line is at 1.44. A positive histogram suggests upward momentum, and the MACD crossover above the signal line reinforces the potential for further gains.
If momentum persists, Litecoin could break above $137 and set its sights on $150. If LTC faces rejection at $137.32, a retracement toward $115-$120 could occur before another breakout attempt. However, a break below $115 may push the price toward $94.46.