
Chainlink (LINK) appears to be showing early signs of a potential trend reversal after a prolonged downtrend dating back to late 2023. On the daily timeframe, bullish divergence has emerged near a critical support at 0.0001368 BTC, which has repeatedly held firm in recent months.
This divergence comes alongside rising momentum indicators, a possible precursor to a breakout. LINK trades at 0.0001559 BTC against Bitcoin, approaching a major resistance zone between 0.0001464 and 0.0001575 BTC.
A clear break and close above this zone would likely confirm a reversal from its bearish structure. The 3000 satoshi level now emerges as a potential target, representing an upside of over 90% from current levels.
RSI, Volume, and Structural Resistance
The RSIhas moved above 70, suggesting strong buying momentum is building. However, this also places it near the overbought range, which historically leads to short consolidations.
Despite this, trading volume has picked up notably during the upward move. This increase in volume may point to growing accumulation from market participants positioning for a shift. The price is pushing against the 0.0001575 BTC resistance, the area LINK must conquer to enter a new uptrend.
According to chart observations, a measured move projection targets 0.000328 BTC. This target aligns with former consolidation zones and high-volume regions from early 2024, supporting the likelihood of a technical rally if the breakout holds.
LINK’s Macro Outlook
Beyond the BTC pairing, LINK’s USD chart reflects a multi-year symmetrical triangle formation. This technical pattern stretches from an all-time high of $52 in May 2021 down to lower highs around $22 and $26.
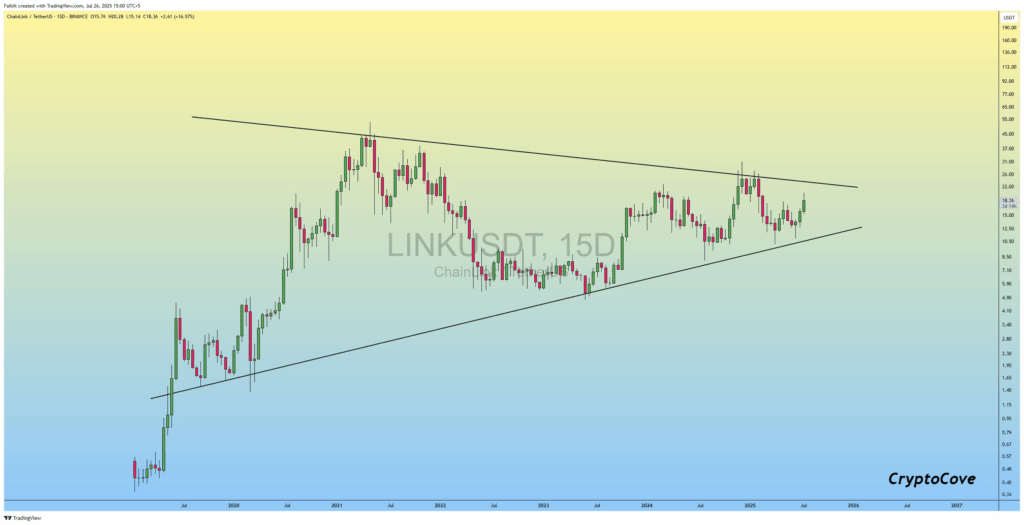
Ascending support lines from lows in 2020 and 2023 create a converging structure. At press time, LINK was trading at $18.36. Price has rebounded from the triangle’s lower boundary and is heading toward the upper resistance.
If bulls can push beyond the $26–$27 range, it would breach the triangle. This move would validate the bullish continuation scenario and may revisit key levels like $37, $52, and beyond. Conversely, if the price fails to break out and moves below $13, downside targets include $10.50 and $7.00.
Price Stability at Key Levels
LINK is within critical breakout zones in both BTC and USD pairs. For the BTC pair, sustained price action above 0.0001575 BTC would confirm trend reversal. For the USD chart, the symmetrical triangle apex expected before year-end could define the broader market direction. Rising volume and technical setups continue to support potential upside, but key resistance levels must be cleared to validate this shift.