
- Dogecoin breaks out from a symmetrical triangle signaling strong bullish momentum, with analysts eyeing a target of $0.36.
- Fibonacci support levels suggest potential accumulation zones before another rally, with key resistance targets up to $0.66.
- Traders anticipate increased volume as DOGE confirms its breakout, reinforcing the likelihood of further upside movement.
Dogecoin (DOGE) breaks out of a symmetrical triangle signaling strong bullish momentum. The price recently surged past the upper resistance trendline, reaching $0.33807. Analysts anticipate a continued uptrend, with a projected target of $0.36. The breakout aligns with standard technical analysis, confirming a potential 9.38% price increase. If buyers sustain pressure, DOGE could experience further upside movement.

Symmetrical Triangle Breakout Signals Uptrend
The symmetrical triangle created by DOGE’s price movement suggests a time of consolidation prior to a clear breakout. The market narrowed into a tightening range after a series of lower highs and higher lows. A breakthrough was on the horizon as the price got closer to the pattern’s peak.
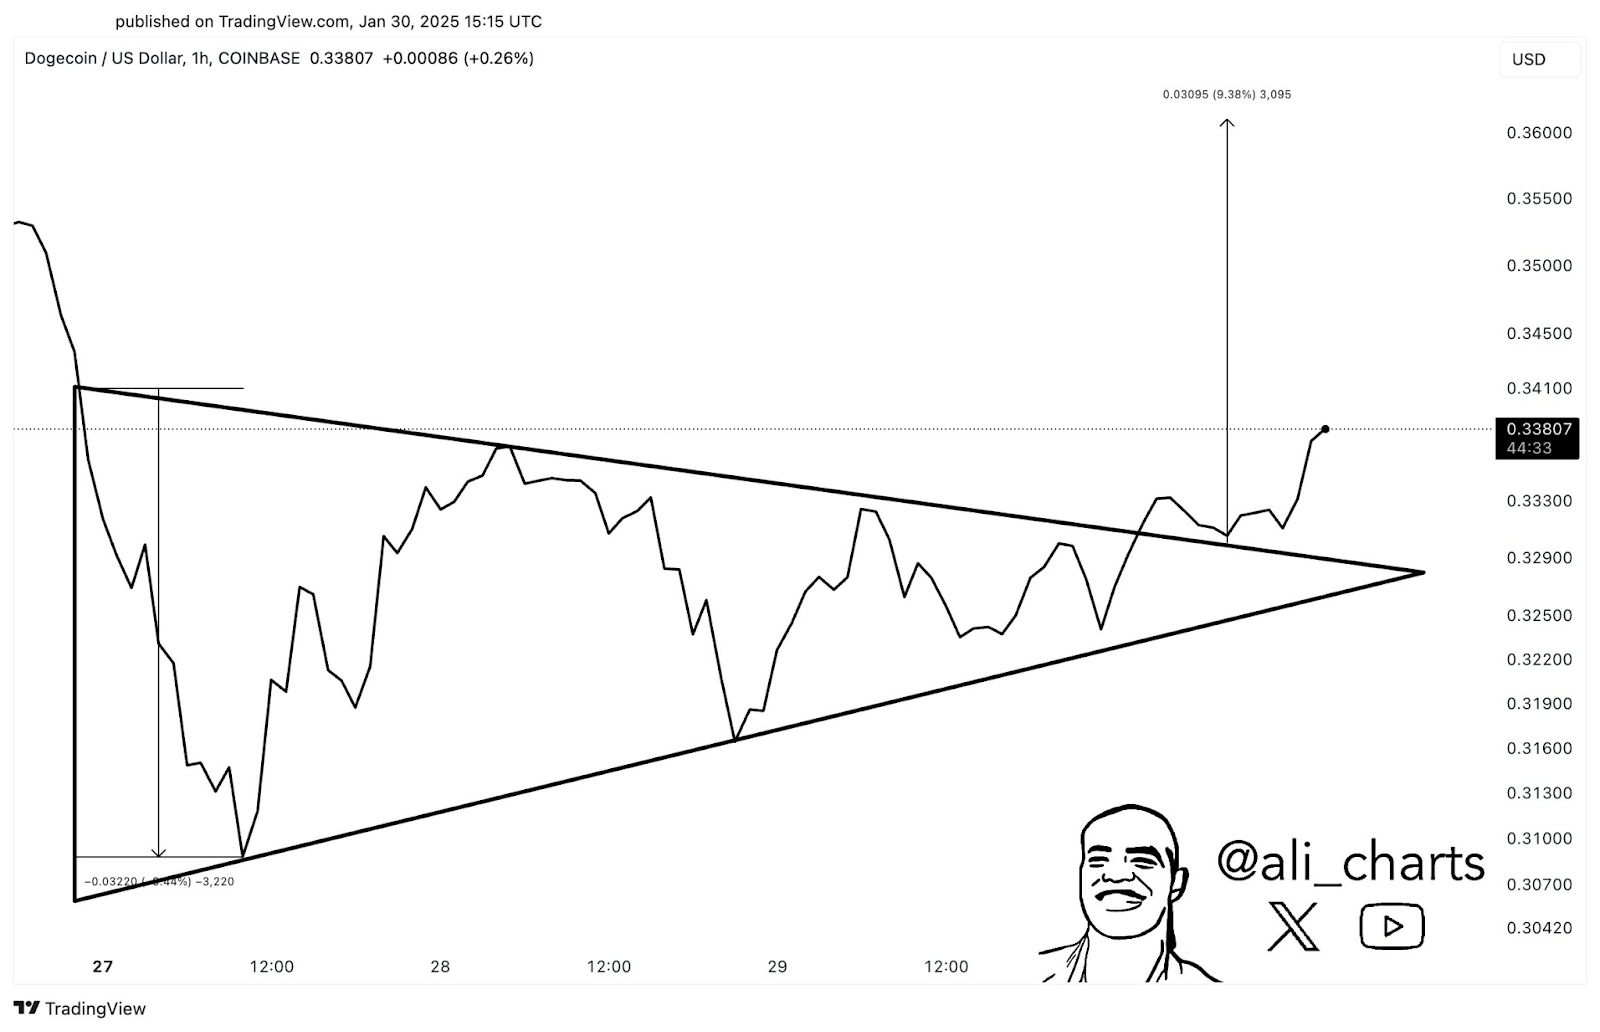
Initially, DOGE saw a sharp decline before recovering within the triangle’s boundaries. Each price movement respected the converging trendlines, suggesting reduced volatility. Eventually, the breakout occurred near the end of the triangle, leading to a rapid price increase. The breakout level stood at approximately $0.333, with a measured move projecting a price target near $0.36.
This technical pattern often precedes a strong continuation of the prevailing trend. With the breakout confirmed, the likelihood of further bullish momentum remains high. Additionally, traders anticipate increased trading volume, which typically accompanies such breakouts.
Fibonacci Retracement Indicates Key Support Zones
Besides the breakout, Fibonacci retracement analysis provides additional insights into DOGE’s price behavior. Analyst Rose Premium Signals identified key support levels where DOGE might accumulate before another bullish wave. The price recently tested Fibonacci support zones, with the golden 0.618 Fib level playing a crucial role.
Currently, DOGE trades at $0.33416, showing a corrective phase after a previous decline. Key support levels lie within $0.26412–$0.27999 and $0.20589–$0.22083. A confirmed bounce from these zones could propel DOGE toward resistance levels.
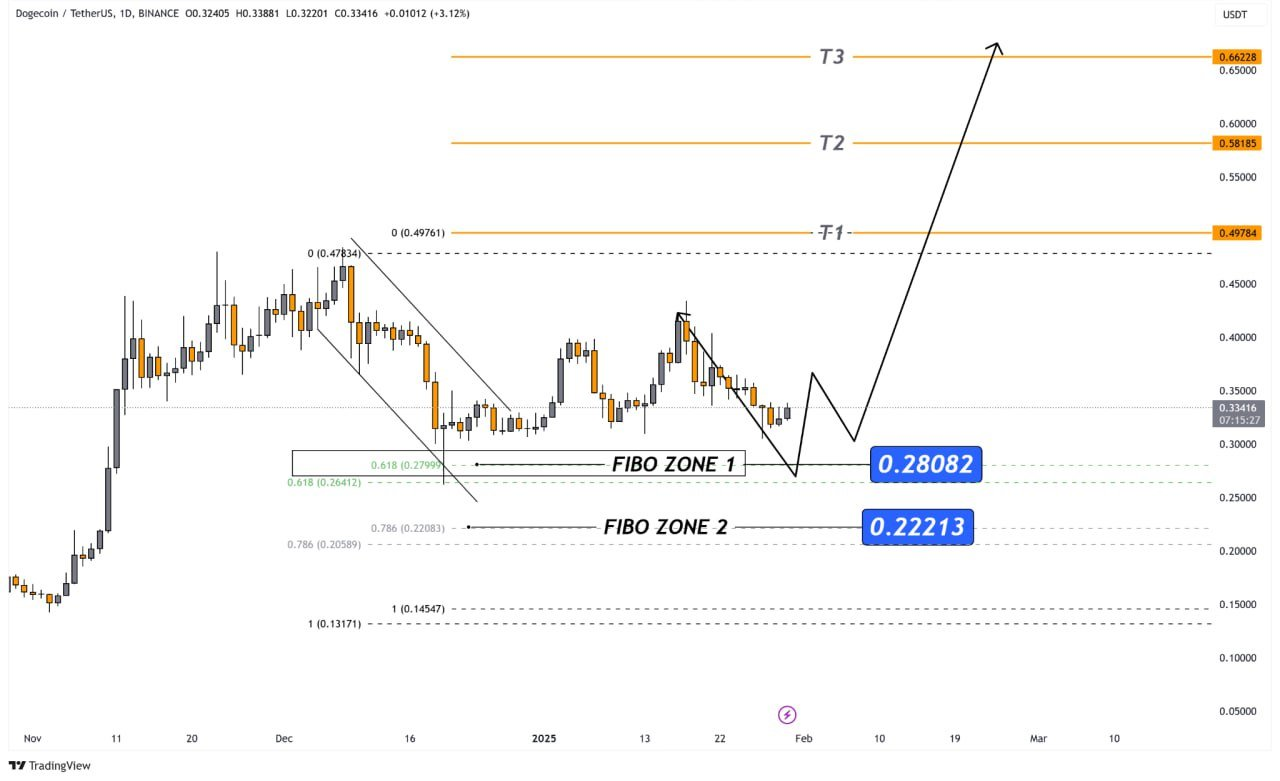
Projected resistance targets include T1 at $0.49784, T2 at $0.58185, and T3 at $0.66228. If history repeats, DOGE could see another explosive rally. Market sentiment remains bullish, with traders monitoring key support areas for potential reversals.