
- JASMY’s primary waves show a bullish “W” pattern with key Fibonacci levels at $0.016430, $0.030935, and $0.040319.
- Major resistance levels for JASMY are marked at $0.041458, $0.049999, and $0.068111, indicating potential upward movement.
- Elliott Wave analysis suggests JASMY’s main targets at $0.065393 and $0.323415, highlighting significant upside potential.
JasmyCoin (JASMY) appears to be in a bullish phase, with technical analysis indicating potential upward movement. Analyst PWebborn confidently suggests that the recent low is in, highlighting completed primary waves and key Fibonacci retracement levels.
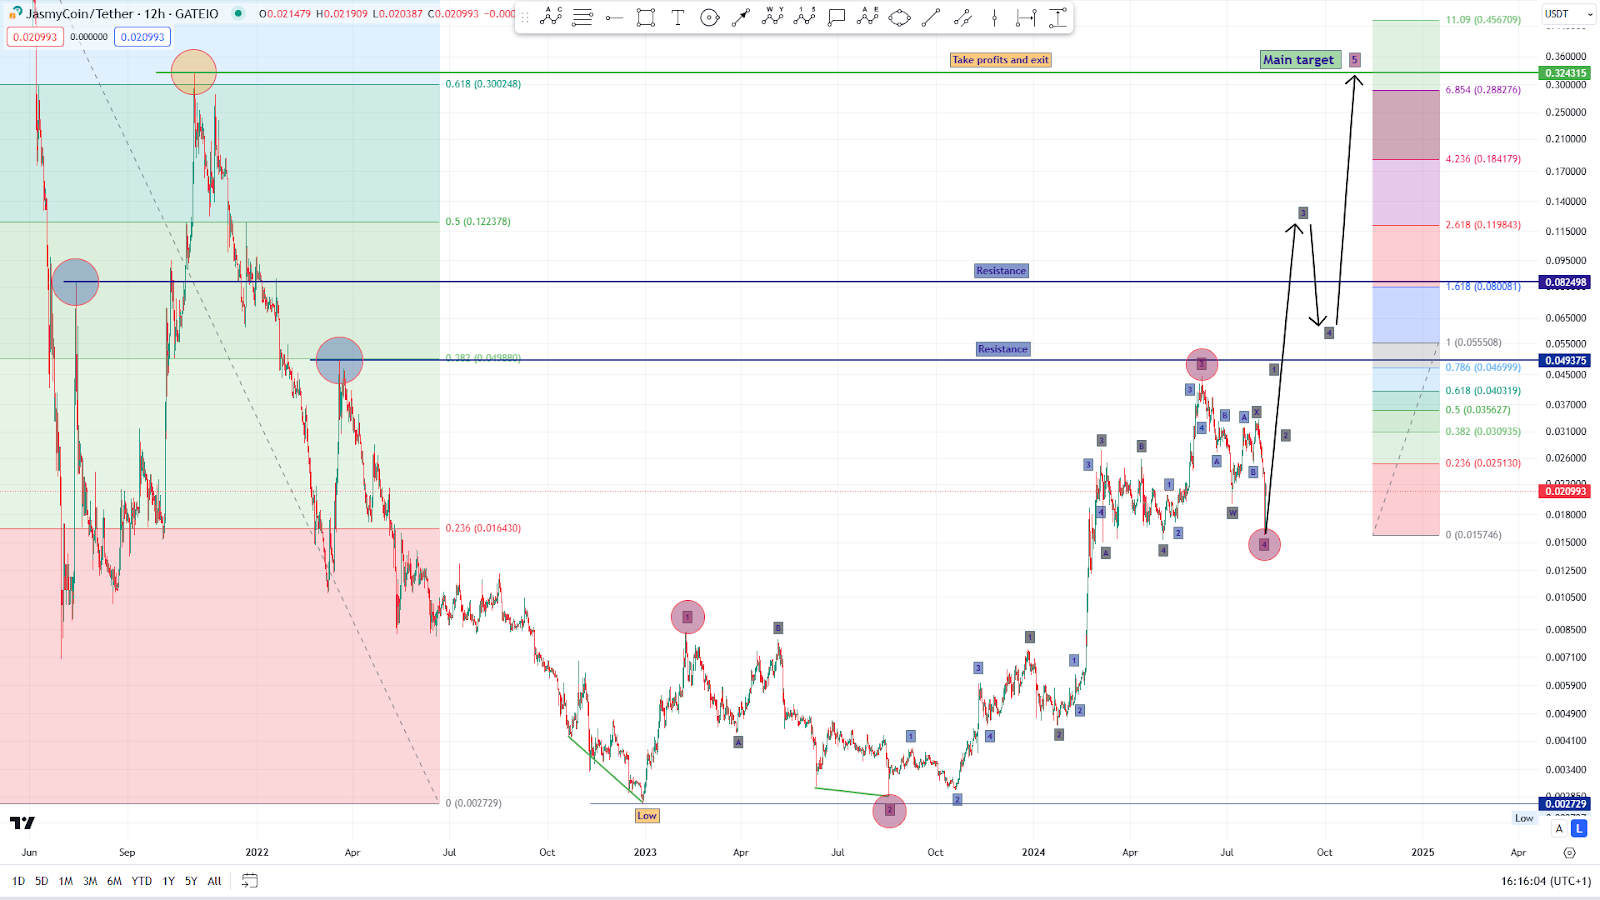
Primary Waves and Fibonacci Analysis
The initial analysis covers primary waves 1 to 4. The first primary wave included minor waves 1 to 5, followed by a corrective primary wave 2 with intermediate waves ABC. Notably, Fibonacci retracement levels are crucial, including 0.236 at $0.016430, 0.382 at $0.030935, and 0.618 at $0.040319.
These levels mark potential support and resistance areas, with resistance observed at $0.041458 and $0.049999. The main target stands at $0.065393, with a long-term target around $0.300424.
The chart suggests a “W” pattern, a bullish reversal signal. Current price action indicates a corrective phase, with two scenarios: a retracement towards $0.026665 before rising or a direct move towards the resistance around $0.049999.
Primary Wave 3 and Future Projections
For primary wave 3, the analysis reveals intermediate waves 1 to 5, almost perfectly scaling 6.854 times the first primary wave. Key Fibonacci levels include 0.236 at $0.025130 and 0.618 at $0.040319. Notable resistance is marked at $0.049375 and $0.068111, with a main target at $0.323415, indicating substantial upside potential.
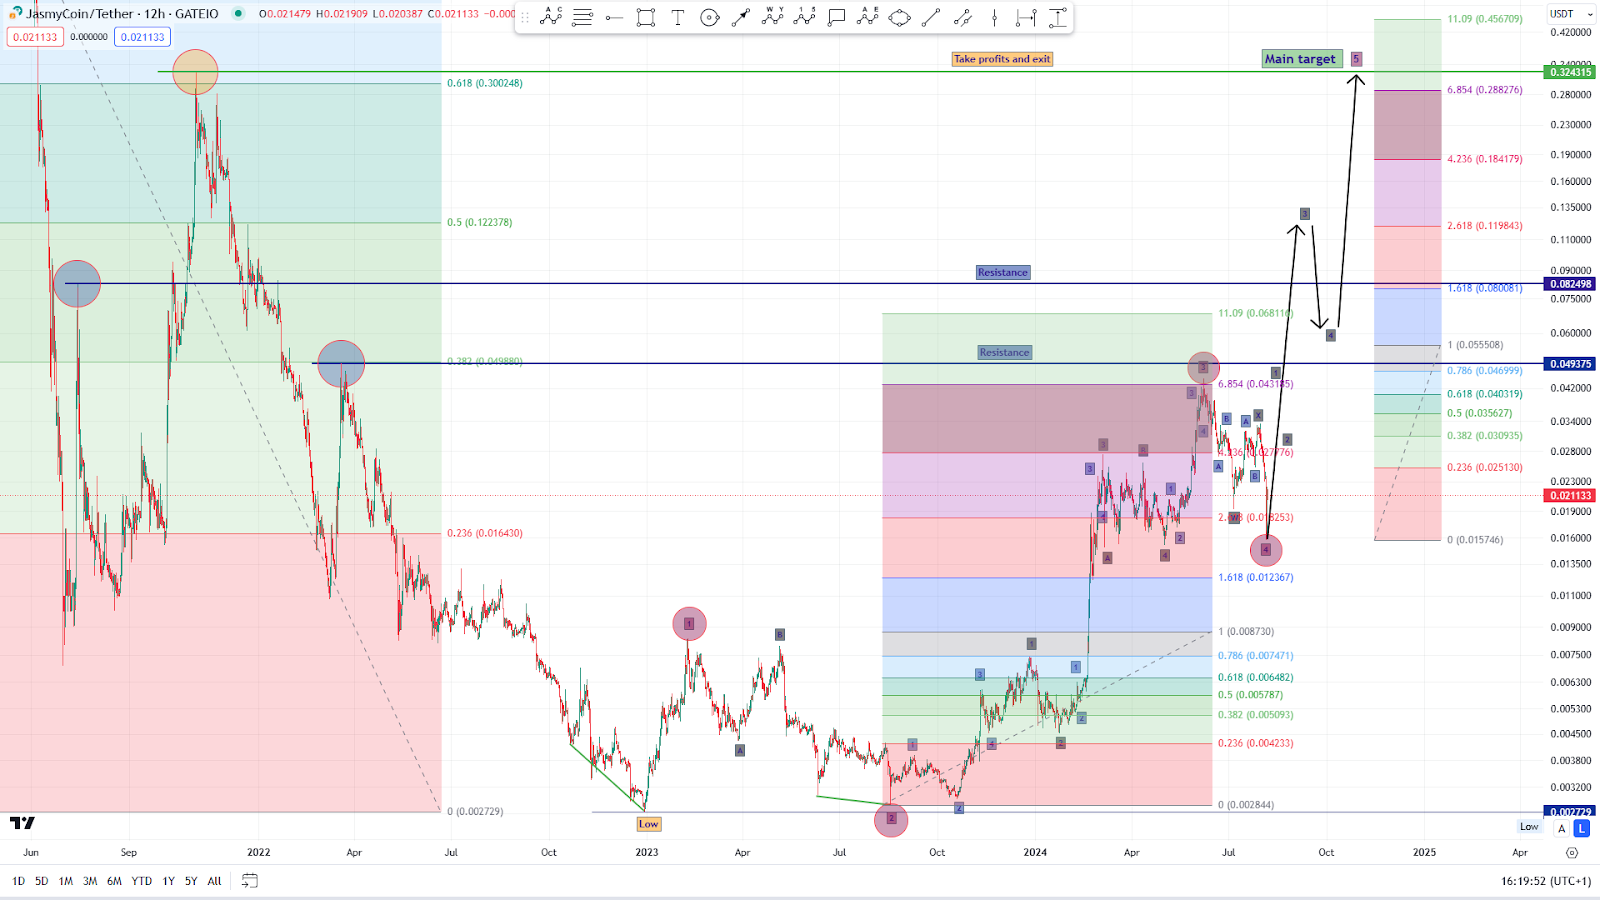
The “W” pattern reappears in this wave, suggesting a bullish reversal. The current price hovers around $0.021133, near the lower Fibonacci levels, implying a consolidation phase before a potential breakout. The chart also outlines pullbacks towards the 1.618 level at $0.012367 before an upward move.
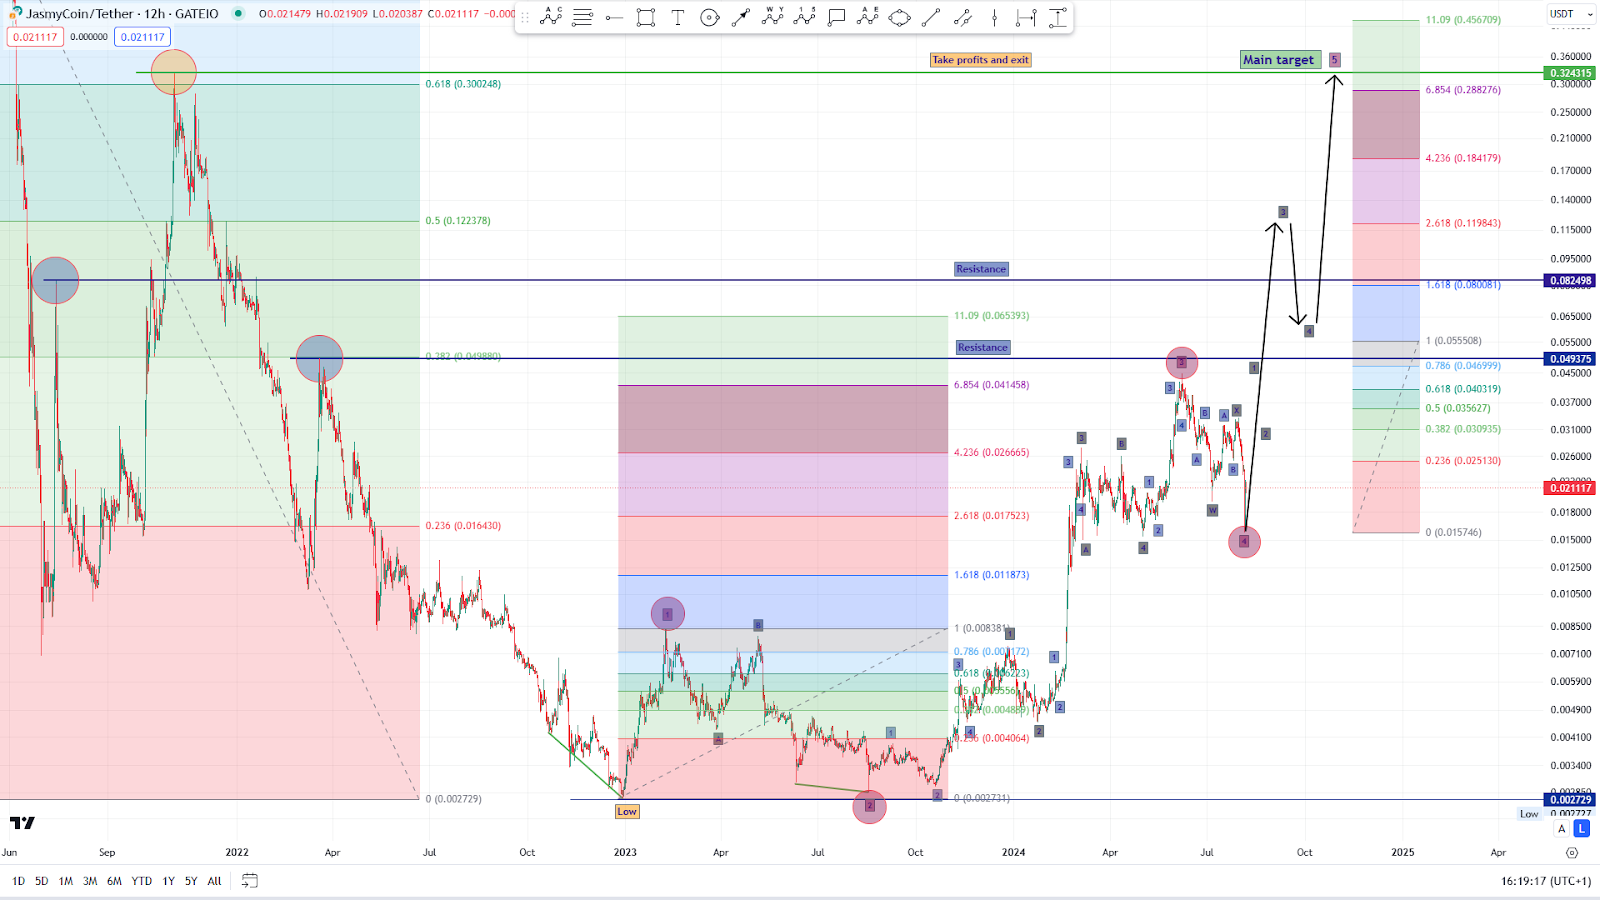
Primary Waves 4 and 5: Elliott Wave Patterns and Key Targets
The analysis for primary waves 4 and 5 includes intermediate waves WXY for wave 4, leading to primary wave 5 with intermediate waves 1 to 5. Key Fibonacci retracement levels include 0.236 at $0.016430, 0.382 at $0.040898, and 0.618 at $0.300248. Resistance levels are identified at $0.040898 and $0.055506.
Elliott Wave patterns suggest the price movement follows predictable market sentiment cycles. Several key price points and targets are marked, including a main target near $0.324315 and a take-profit level around $0.300248. The current price is $0.020993, with a recent low at $0.002729, which could act as significant support.
Intraday Price Action and Market Sentiment
The 1-day price chart for JASMY against USDT shows the current price at $0.0222, indicating an upward trend. The price has fluctuated between $0.0210 and $0.0222, showing significant volatility. Support is observed around $0.0210, while $0.0222 may act as resistance.
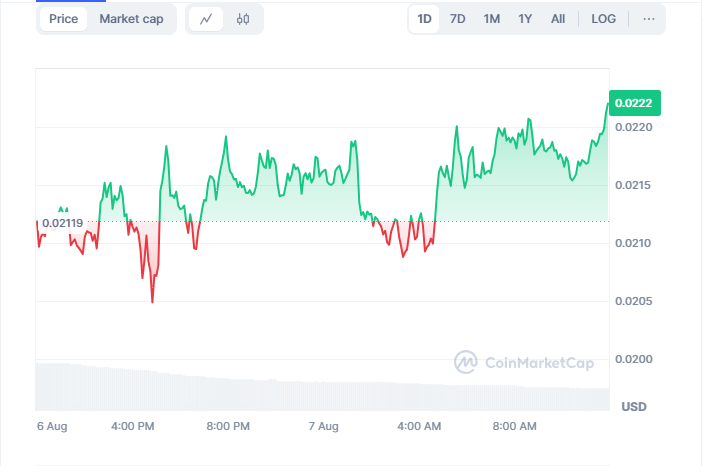
Source: CoinMarketCap
The intraday trend is bullish, with the price reaching new highs. Key levels to watch include the support at $0.0210 and resistance at $0.0222. The chart suggests a positive trend, but the volatility implies caution. The market should monitor pullbacks to support levels and potential resistance at current highs to gauge future price movements.
Overall, JASMY’s technical analysis reflects a bullish outlook with significant targets and key resistance levels. The Fibonacci retracement levels and Elliott Wave patterns indicate potential for a strong upward move if the price can break through marked resistance levels. The intraday trend supports this bullish sentiment, with ongoing volatility suggesting active trading and potential for both short-term gains and losses.