
- JASMY mirrors earlier wedge formations with RSI support and price compression, forming a structure that resembles previous cycle-bottom setups on the charts.
- Intraday trading shows controlled upward movement, steady consolidation, and a final modest rebound as buyers defend the lower boundary within the tight range.
- Market-cap data reflects early distribution, a sharp drop with quick recovery, and later stabilization near $360M before BTC-pair prices settled lower.
JASMY continues to draw attention as recent market data points to tightening price conditions and recurring technical patterns during the week. The asset moves within a narrow range while market structure shows repeated compression phases that traders are watching closely.
Recurring Technical Structure Emerges
JASMY’s RSI bounced from support again, aligning with a multi-year pattern of falling-wedge formations. The chart compared past wedges with the present structure, each followed by long compression periods and later breakouts.
The recent setup shows another tightening wedge with a wick beneath support, suggesting temporary liquidity testing rather than sustained selling.The indicator panel shows higher lows while price makes lower lows.
This pattern has appeared during earlier cycle bottoms on the chart. Although not a confirmation of trend reversal, the structure resembles phases where selling pressure softened.
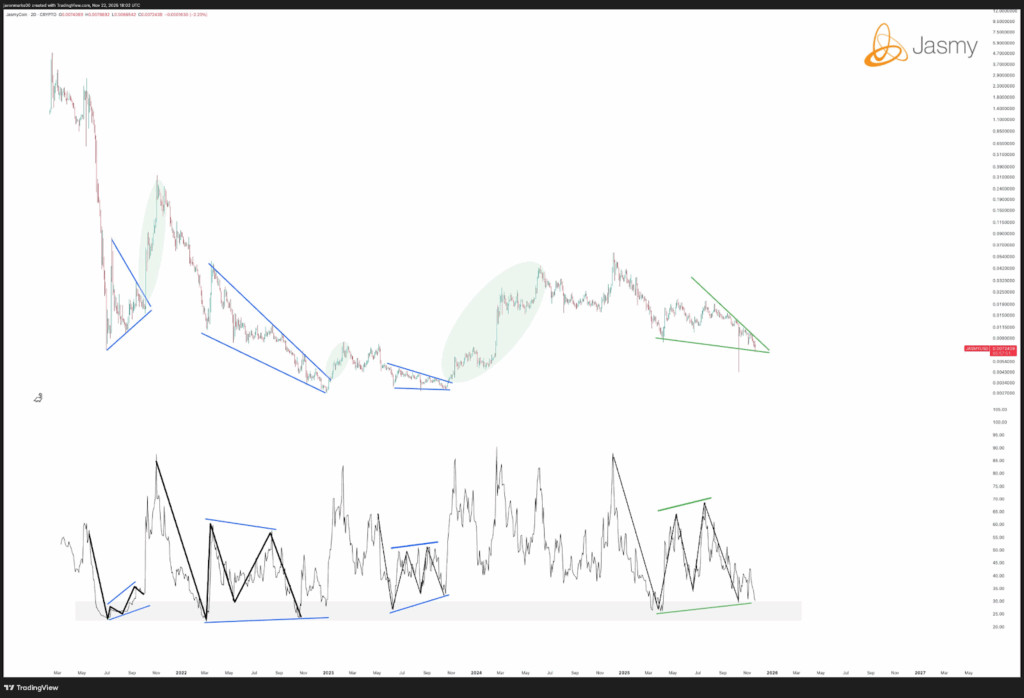
Market participants watching these levels note the historical rhythm between divergence, compression, and volatility expansion.This alignment of RSI movement and price compression positions JASMY near another decision point.
Intraday Activity Shows Controlled Movement
Intraday data shows JASMY trading between roughly $0.271 and $0.276 during a tight session. Early activity produced an upward move driven by renewed buyer interest.
The chart then shifted into higher lows mixed with short pullbacks as the asset held its trend while consolidating inside a narrow structure.A midday crest formed after steady gains, creating a rounded top that reflected cooling momentum.
Even with the slowdown, sellers did not pull the asset sharply downward. Instead, the chart maintained support levels near the lower boundary of the range, showing measured participation.
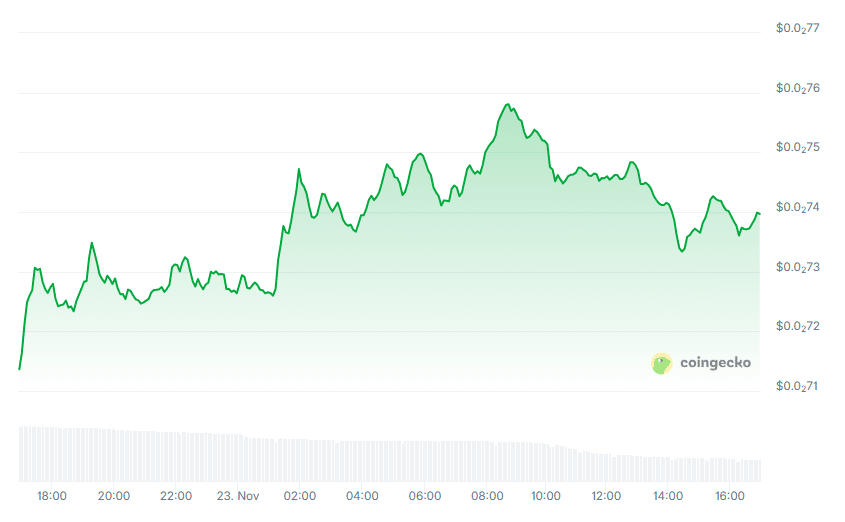
Later in the session, JASMY recovered modestly from the $0.273–$0.274 area. This gradual lift suggested buyers continued to defend the range. The pattern kept the market balanced and ready for the next move.
Market Cap Shows Pressure Followed by Stabilization
Weekly market-cap data shows a fall from near $420M toward the $340M zone before a partial recovery. The early portion of the chart depicts controlled distribution, where selling developed without sharp reactions.
A brief rebound around mid-November appeared but lacked strength to extend upward.A sharper decline arrived near 21 November as the market cap dropped toward its lowest point of the week.
The move resembled forced selling conditions before reversing quickly. The rebound formed a clean V-shape, showing rapid value rotation back into the market.