
- DASH moves out of a long accumulation phase with a decisive breakout that brings renewed volume and shifts attention toward higher structural targets.
- Trader posts outline ambitious price projections as short-term charts confirm a wedge breakout supported by constructive retests and strong upward momentum.
- DASH ecosystem metrics show renewed TVL growth in early Q4 2025, signaling increased participation.
DASH is drawing attention with technical developments across multiple timeframes. Market observers note that recent moves come after a lengthy period of compression, setting the stage for an expanded phase of trading activity.
Long-Term Structure Shows Extended Accumulation
DASH appears to be emerging from a long stretch of downward pressure that lasted several years. The chart indicates a persistent decline marked by a descending trendline that consistently held back upward attempts.
This trend eventually shifted into an accumulation phase lasting about 615 days, during which volatility narrowed.The move suggests renewed market participation and a shift in sentiment.
Analysts referenced this structure while noting that a projected zone near $537 represents a potential target based on the chart’s long-term pattern.The vertical rise seen on the chart points to aggressive buying interest.
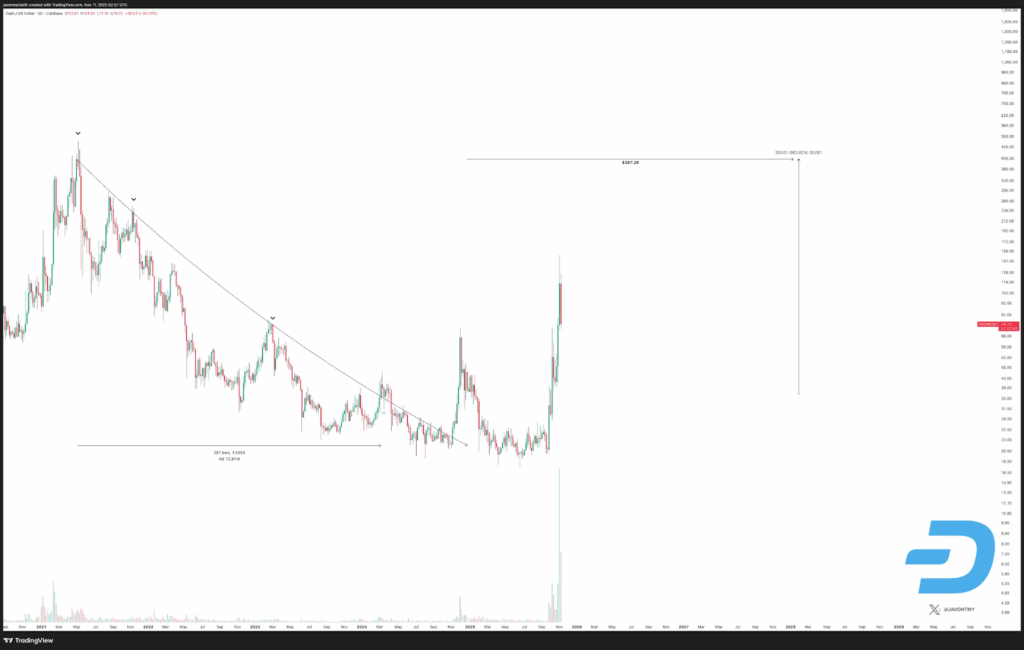
Although the price advance remains steep, observers emphasize the descriptive nature of the analysis rather than any prediction. The chartist’s outlook centers strictly on structural behavior already present in the data.
Social Commentary Tracks Short-Term Breakout
Trader JavonTM1 referenced DASH in recent posts, stating that a target around $397.26 remains unchanged. He noted that pullbacks have aligned with the broader breakout structure, leaving more than 333% of distance between current levels and his stated figure.
Another message from the same account referenced expectations of a potential >414% increase from earlier trading levels. These comments coincided with lower-timeframe patterns that show the market reacting to a breakout from a falling wedge.
On the 2-hour chart, DASH moved above the wedge’s upper boundary during a strong surge. A brief retest followed, forming a constructive confirmation often observed after similar breakouts. The projected area between $165 and $170 stems from the preceding impulse leg.
Ecosystem Activity Reflects Shifts in Participation
DASH also showed movement in its ecosystem metrics.Total Value Locked TVL grew sharply in early 2024, climbing above $600,000 during a period of stronger altcoin participation.
This rise aligned with elevated network usage before shifting downward.Since then,DASH’s TVL has stayed mostly between $150,000 and $200,000, creating a steady base of activity.
Later in TVL began to rise again and moved into the mid-$200,000 range, showing that interest in the network was starting to return.