
- $IO sees heavy selling but shows signs of a potential rebound as volume surges at key price levels. Traders watch for confirmation.
- Breaking $2.30 could signal a bullish reversal, with historical data supporting strong reactions near this critical zone.
- Despite a sharp drop to $1.20, the increased volume suggests accumulation by larger players, hinting at a possible market shift.
$IO witnessed a major price drop with analyst CryptoBullet noting that yesterday’s daily candle caused damage to the chart. However, today’s price action shows signs of potential stabilization. Besides, the trading volume has surged, exceeding yesterday’s already high volume. This suggests growing market interest at current levels.
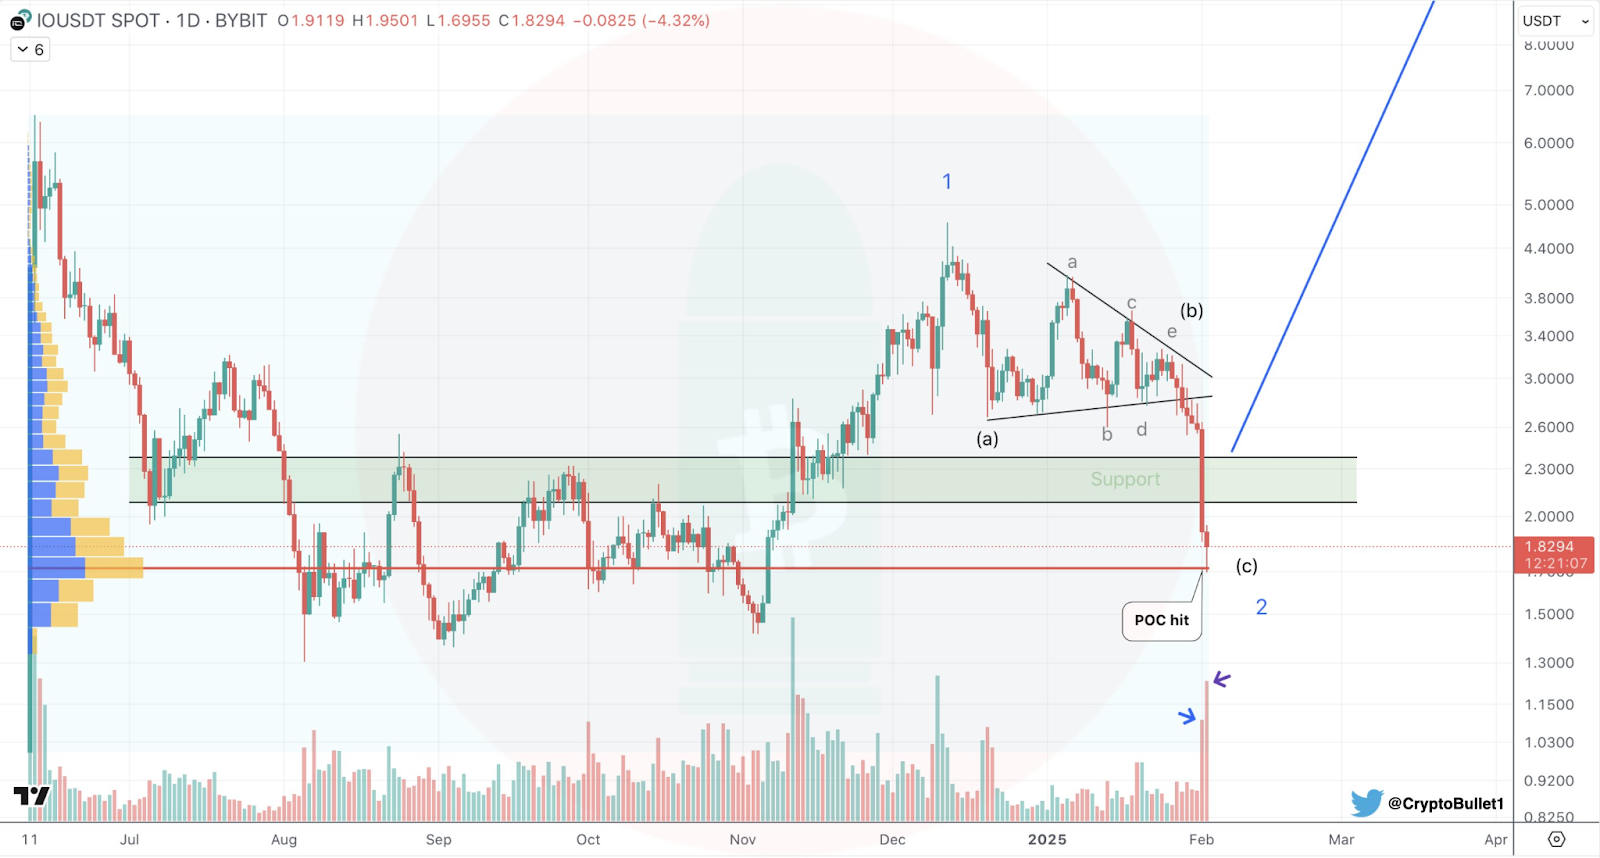
The $IOUSDT on Bybit reveals a sharp decline after breaking a descending triangle. Consequently, selling pressure intensified, pushing prices lower. The Elliott Wave correction pattern labeled A-B-C shows Wave C extending downward. This movement suggests the final stage of the correction is nearing completion.
Significant Volume Surge at Key Levels
Yesterday’s red candle recorded the largest selling volume since November 13. However, today’s candle, despite being smaller, has already surpassed that volume. Additionally, the price hit the Point of Control (POC) on the Fixed Range Volume Profile (FRVP). This marks a crucial trading level with high historical volume activity.
A key support level at $2.30 was breached, confirming strong bearish sentiment. The price then dropped to $1.20 before rebounding. This region attracted buyer interest, as seen in the increasing volume. Hence, this suggests accumulation by larger market participants at lower prices.
Potential Reversal in Sight?
Market structure analysis indicates a completed corrective wave. The descending wedge formation within Wave B hinted at weakness before the major breakdown. Moreover, a liquidity cluster exists between $1.20 and $1.50, further strengthening this zone’s importance.
If buying pressure continues, a recovery could emerge. A breakout above $2.30 would confirm bullish momentum. Consequently, this would open the door for a reversal toward higher price levels. Additionally, historical price action supports strong reactions near these key zones. Moreover, a notable increase in buying pressure could mark a trend shift. If sustained, this might indicate a new bullish phase.