
- INJ approaches a long-standing trendline resistance after recovering over 100% from cycle lows near $3.
- Trading volume jumped above 72%, while price held gains following a move toward the $7 region.
- Exchange netflows turned sharply positive as INJ attempted a breakout from a multi-month downtrend.
INJ Breakout Watch remains firmly in focus as traders monitor a key technical level. Market participants are tracking strengthening momentum while capital flows continue improving across the Injective ecosystem.
INJ Approaches Major Technical Resistance
A recent chart shared on social media showed INJ nearing trendline resistance. The descending barrier has constrained price action for several months. Multiple rally attempts previously failed near the same technical level.
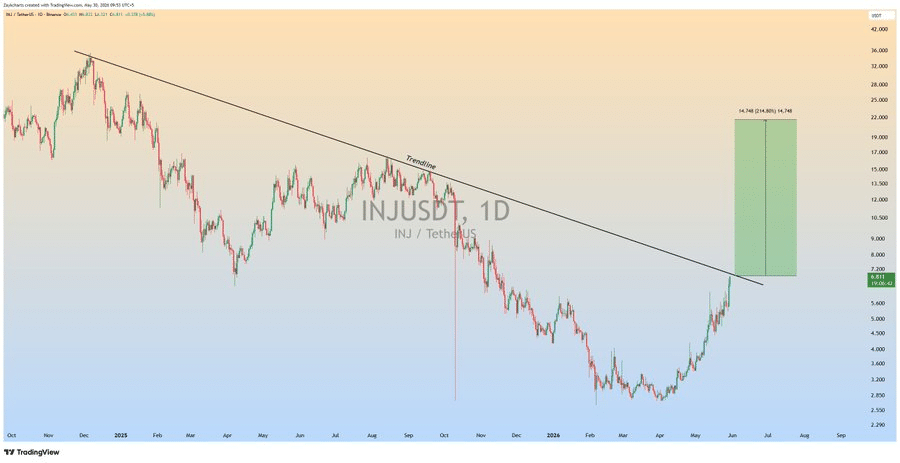
The trendline stretches from highs recorded during late 2024. Since then, the asset established a pattern of lower highs. Sellers repeatedly defended resistance during each recovery phase.
As of writing, price action differs from previous failed breakout attempts. INJ recovered steadily after establishing a bottom near $3. Buyers gradually built a sequence of higher lows.
The recovery carried price above the $6.50 area recently. Market structure remained constructive throughout the advance. As a result, attention shifted toward a possible breakout confirmation.
Volume Expansion Supports Market Strength
INJ as of writing is trading near $6.60 during the session. The token gained nearly 10% over a 24-hour period. Market capitalization climbed beyond the $660 million level.
Trading volume increased more than 72% during the move. Daily turnover reached approximately $347 million across exchanges. Rising volume accompanied the latest price advance.

Price initially traded near the $6.00 region before accelerating higher. Momentum buyers entered after resistance around $6.20 broke. The rally subsequently pushed toward the $7.00 area.
After reaching session highs, price entered a consolidation phase. Selling pressure remained relatively controlled throughout the pullback. Buyers continued defending support between $6.40 and $6.50.
Exchange Flows Reflect Growing Participation
Spot inflow and outflow data revealed changing investor behavior. Exchange activity remained volatile during the broader market decline. Large inflows and outflows frequently accompanied falling prices.
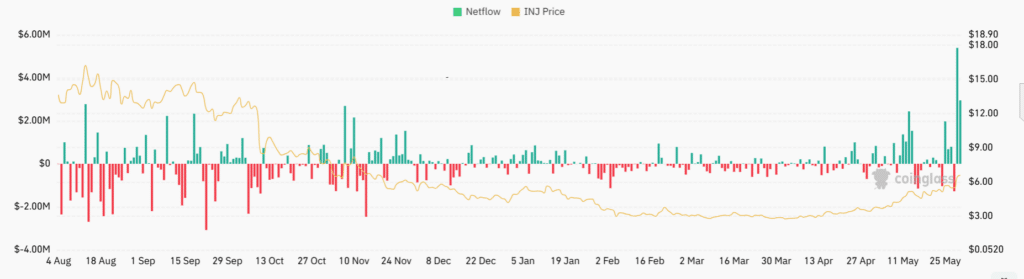
Conditions became noticeably calmer between February and April. Netflows stabilized while INJ established a base near cycle lows. Such periods often coincide with accumulation activity.
More recently, exchange inflows increased significantly during May. Several positive netflow spikes appeared alongside rising prices. One of the largest inflow readings approached the $5 million mark.
The increase in exchange activity coincided with improving momentum. Positive netflows emerged as INJ challenged long-term resistance. Capital participation therefore strengthened during a critical technical period.
The broader setup now centers on the descending trendline. A confirmed breakout could shift attention toward higher resistance zones. Until then, traders continue monitoring volume, support levels, and exchange flows.