
- Bitcoin’s price holds above key Ichimoku levels, signaling a potential local bottom and continuation of its bullish trend.
- The Tenkan-sen and Kijun-sen lines act as strong support, with past interactions leading to bullish reversals.
- Bitcoin’s retracement aligns with liquidity zones, suggesting a bounce if support levels hold, but further confirmation is needed.
Bitcoin remains in a strong uptrend despite a recent pullback, with signs of a local bottom forming. Titan of Crypto highlights Bitcoin’s monthly Ichimoku analysis, emphasizing key support zones. The cryptocurrency retested and closed above the Tenkan-sen, similar to past bullish reversals. Moreover, it held within a Fair Value Gap (FVG), suggesting a possible continuation of the upward trend. However, further confirmations are needed before declaring a definitive market shift.
Bitcoin’s Technical Setup and Key Levels
Bitcoin’s price action continues to exhibit bullish characteristics, supported by Ichimoku indicators. The red Tenkan-sen line closely follows price movements, while the blue Kijun-sen acts as a dynamic support level. Notably, previous local bottoms formed when the price interacted with the Kijun-sen before reversing upwards.
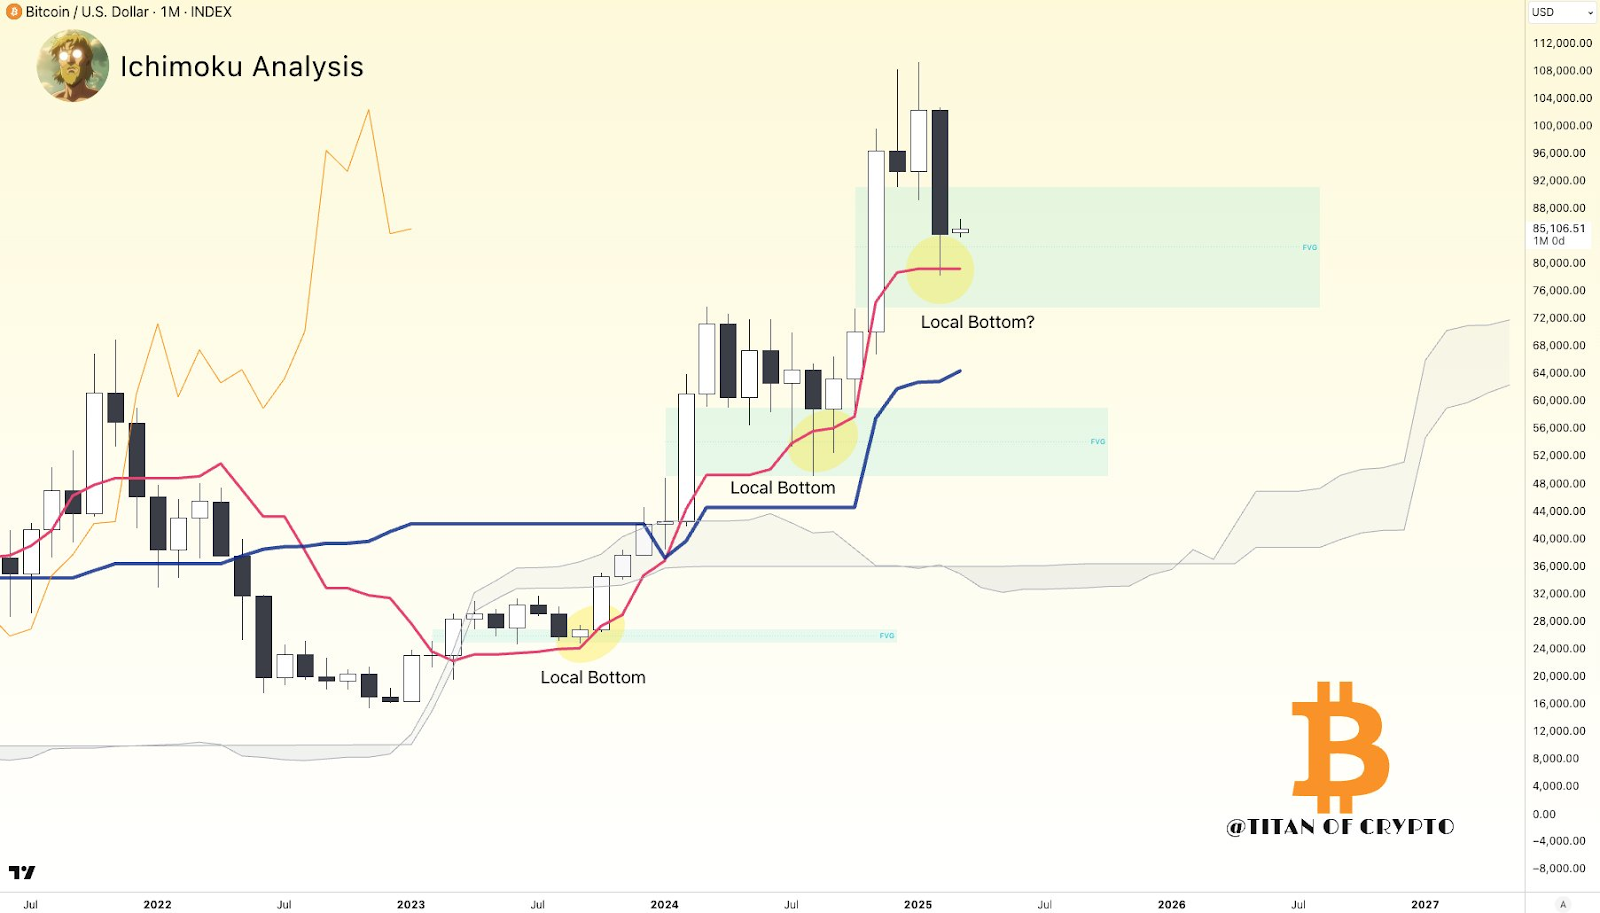
Additionally, Fair Value Gaps (FVGs) are zones of liquidity where Bitcoin previously enjoyed support. The continued retracement brings the price in closer proximity to the Tenkan-sen, suggesting a local bottom may form. If this level remains resilient, Bitcoin can persist with its bullish trajectory. But a continuation of the fall may test the Kijun-sen, rendering it firmer as second-level support.
Market Indicators and Future Projections
The Ichimoku Cloud (Kumo) remains bullish, with its leading span projecting continued upward momentum. The lagging Chikou Span also remains above the price, further confirming the overall bullish structure. Additionally, previous interactions with key indicators resulted in trend reversals, supporting the possibility of another bounce.
Bitcoin’s price history shows that retracements often lead to continuation patterns rather than complete trend reversals. The upcoming sessions will determine if Bitcoin finds support at the Tenkan-sen or extends its decline toward the Kijun-sen. Furthermore, an FVG zone above the current price could serve as an additional support level.