

- Analyst identifies a potential head-and-shoulders pattern, with a 12-hour close below 76–78 exposing downside targets at $62 and $59.
- Michael van de Poppe expects HYPE to recover toward 112–116, identifying 80–84 as a potential buying zone.
- Technical indicators remain bearish, with RSI at 41.05 and MACD below its signal line; immediate support sits at 82–83.
Hyperliquid faces competing price forecasts as weakening momentum raises the risk of a deeper correction. Analyst Ali Charts sees a potential 22% decline toward $59, while Michael van de Poppe maintains a 112–116 upside target. HYPE traded at $83.76, with technical indicators showing continued selling pressure after its late-October recovery.
Analyst Identifies 76–78 as Critical Support
According to Ali Charts, HYPE is forming a potential head-and-shoulders top on its 12-hour chart. The pattern could expose the token to a 22% correction if support breaks.
The analyst identified 76–78 as the neckline requiring confirmation. A sustained 12-hour close below this region would confirm the bearish setup. The first downside target stands at $62, followed by $59.
However, Ali Charts noted that a recovery above the right shoulder’s high would weaken the formation. A bounce from the neckline could also prevent the pattern from developing.
Van de Poppe Maintains $116 Price Target
Meanwhile, analyst Michael van de Poppe expects HYPE to reach above $100 in the near future. He compared its recent price movements with August’s recovery pattern.
According to van de Poppe, HYPE swept its recent low before bouncing sharply and breaking previous highs. He expects another rally following the current consolidation.
He identified 80–84 as a potential buying region during a correction. His next upside targets stand at 112–116.
HYPE Indicators Show Continued Selling Pressure
HYPE recently traded at $83.76, gaining 0.64% after opening at $83.214. Its intraday high reached $84.013. However, the broader decline from approximately $95 in early October remains visible. The token approached $76 around October 25 before recovering above $94 on October 29.
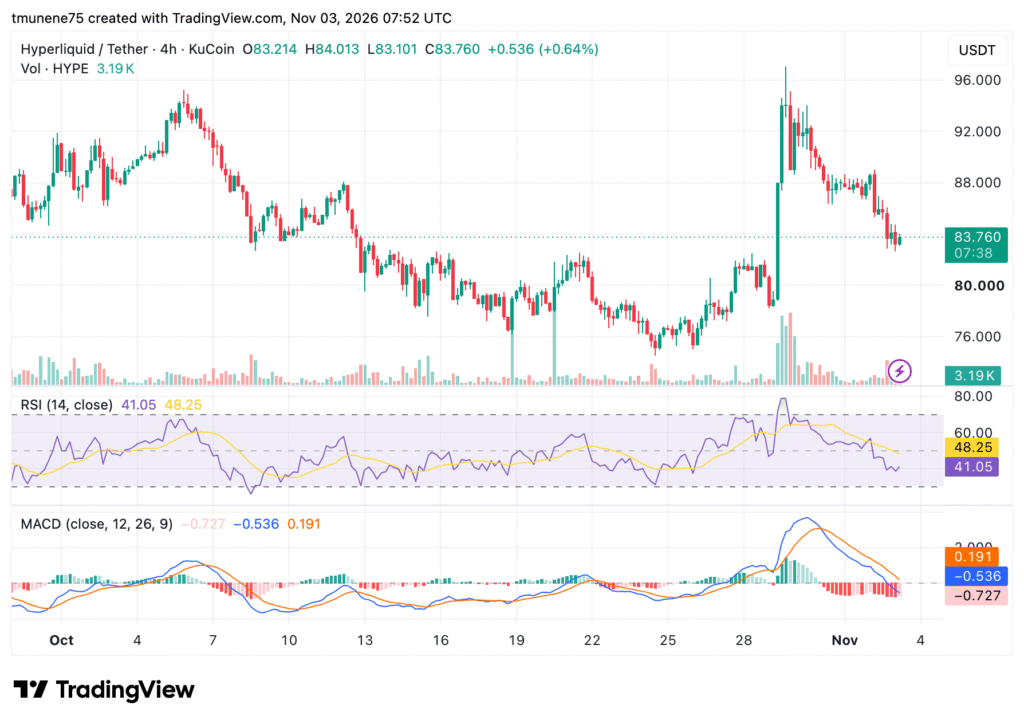
Trading volume increased sharply during that rebound, but sellers subsequently pushed prices lower. The RSI is at 41.05, below its 48.25 moving average. Meanwhile, the MACD line is at -0.536, below its 0.191 signal line. Its histogram also remains negative at -0.727.
Immediate support is between $82 and $83, followed by $80 and $76. On the upside, resistance is at 85–88, then 92–94. A sustained recovery above $88 would improve the bullish outlook.