
- Green Satoshi Token (GST) shows a bull trend with resistance breaking with large volume, potentially having a 480% rise.
- Market consolidation happens as GST’s breakout, with higher highs and buying interest signalling continued upward momentum.
- Disguised bullish divergence in GST price action indicates opportunity for additional appreciation if support maintains above the point of the breakdown.
Green Satoshi Token (GST) has witnessed indications of likely trend reversal from a prolonged bearish trend. Current price trend and volume relations indicate a turn in market attitudes, with specialists indicating a bullish push.
Breakout Confirms Shift in Market Trend
Market analyst Javon Marks announced a change in GST’s price action, pointing to an emerging bullish trend. The token had up to that point been following a steep downtrend, with lower highs and lower lows in consecutive days. A declining trendline had characterized this market trend until the price broke through, pushing above resistance. Trading volume picked up during the breakout, reflecting rising buying pressure.
After the breakout, GST experienced a temporary rally before it reached resistance, triggering a pullback. Volume level recorded rising volume at the point of the breakout to affirm that market direction was changing. As price moved closer, while it retraced, trading diminished, suggesting that price was headed for consolidation. During this period, price movements remained within a defined range, with a secondary peak aligning with another volume spike.
Potential Price Recovery and Key Resistance Levels
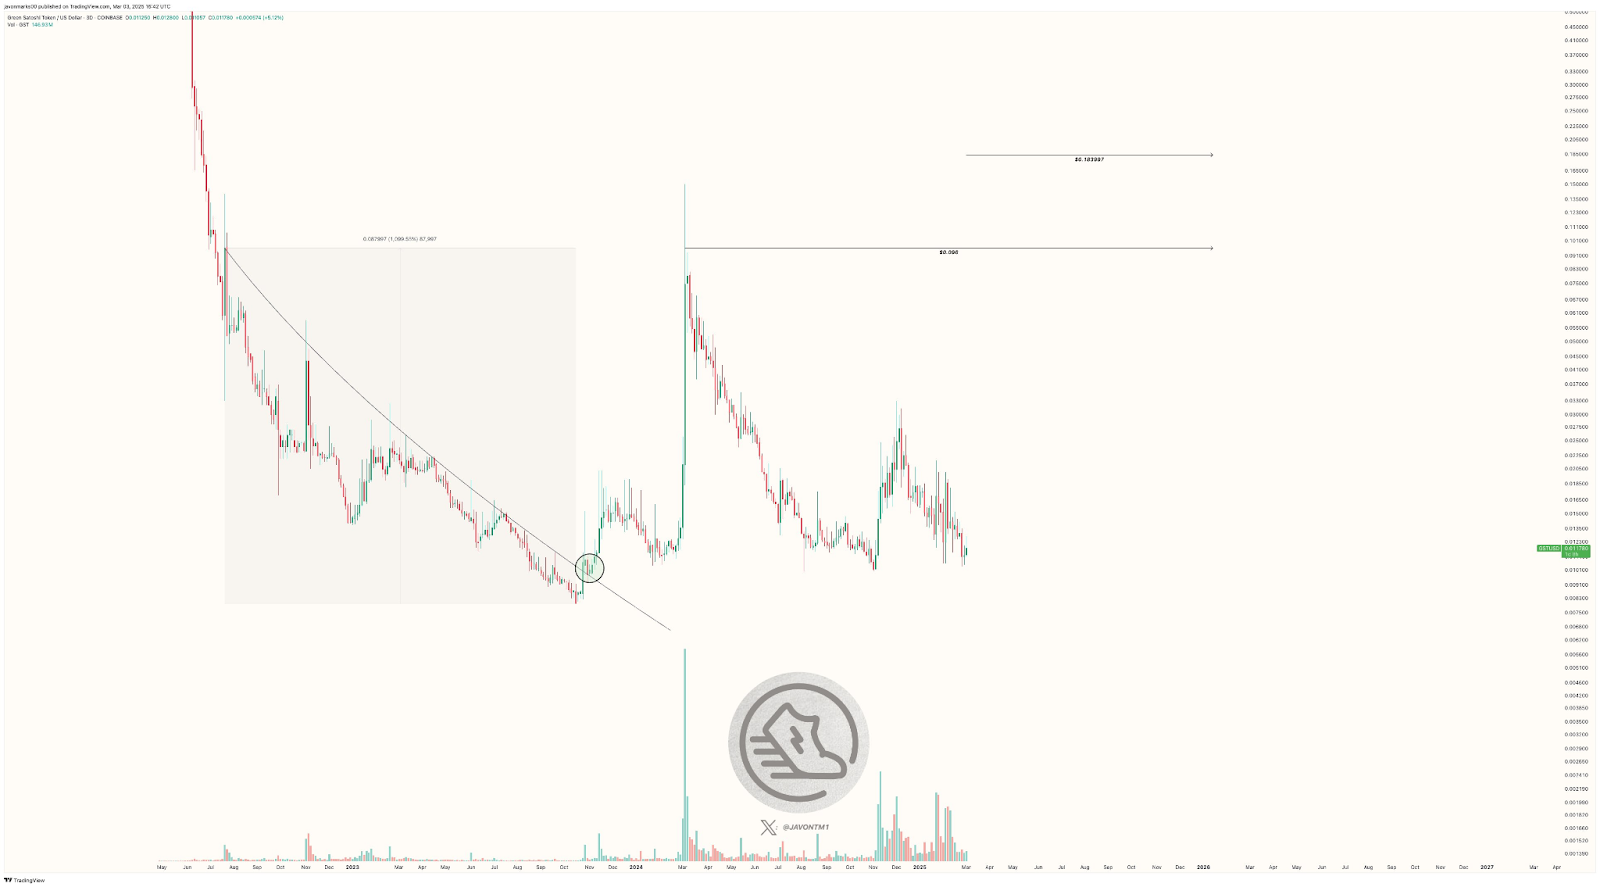
Javon Marks’ assessment suggests that GST could gain over 480%, with price targets projected at $0.096 and possibly $0.183. These levels correspond with previous resistance zones observed in historical price action. Candlestick wicks at higher levels indicate selling pressure at resistance points, leading to temporary rejections. Despite this, GST continues to maintain a bullish structure by sustaining support above the breakout level.
Analysts note that a transition from bearish to bullish momentum appears evident, as the market forms higher highs and higher lows. Breakout phases have been accompanied by trading volume surges, while consolidation periods have shown stabilization. The breakout zone remains a key support level, defining the shift in trend dynamics. Price movements reflect structured cycles influenced by volume activity and resistance levels.
Additionally, the presence of a hidden bullish divergence pattern suggests the possibility of further upward movement. Buying pressure has increased at breakout points, while lower activity during corrections signals market stabilization. If GST maintains its position above the breakout level, further gains could materialize in the near term.