
- Golden cross pattern in the altcoin market indicates a bullish trend similar to 2020, hinting at a potential rally.
- Despite recent volatility, altcoins maintain an upward trend, signaling long-term growth possibilities.
- Convergence of 50- and 200-month moving averages in 2024 could mark a crucial point for altcoin market momentum.
The altcoin market has shown resilience despite the recent downturn, with the golden cross still visible in the monthly data. This pattern, a bullish indicator for traders, remains in the total market capitalization.
Crypto analyst @el_crypto_prof has noted this on X, drawing attention to the potential significance of this trend. The last time such a pattern appeared was in 2020, which coincided with a major market rally, hinting at possible future movements in the altcoin space.
Analyzing Key Market Trends
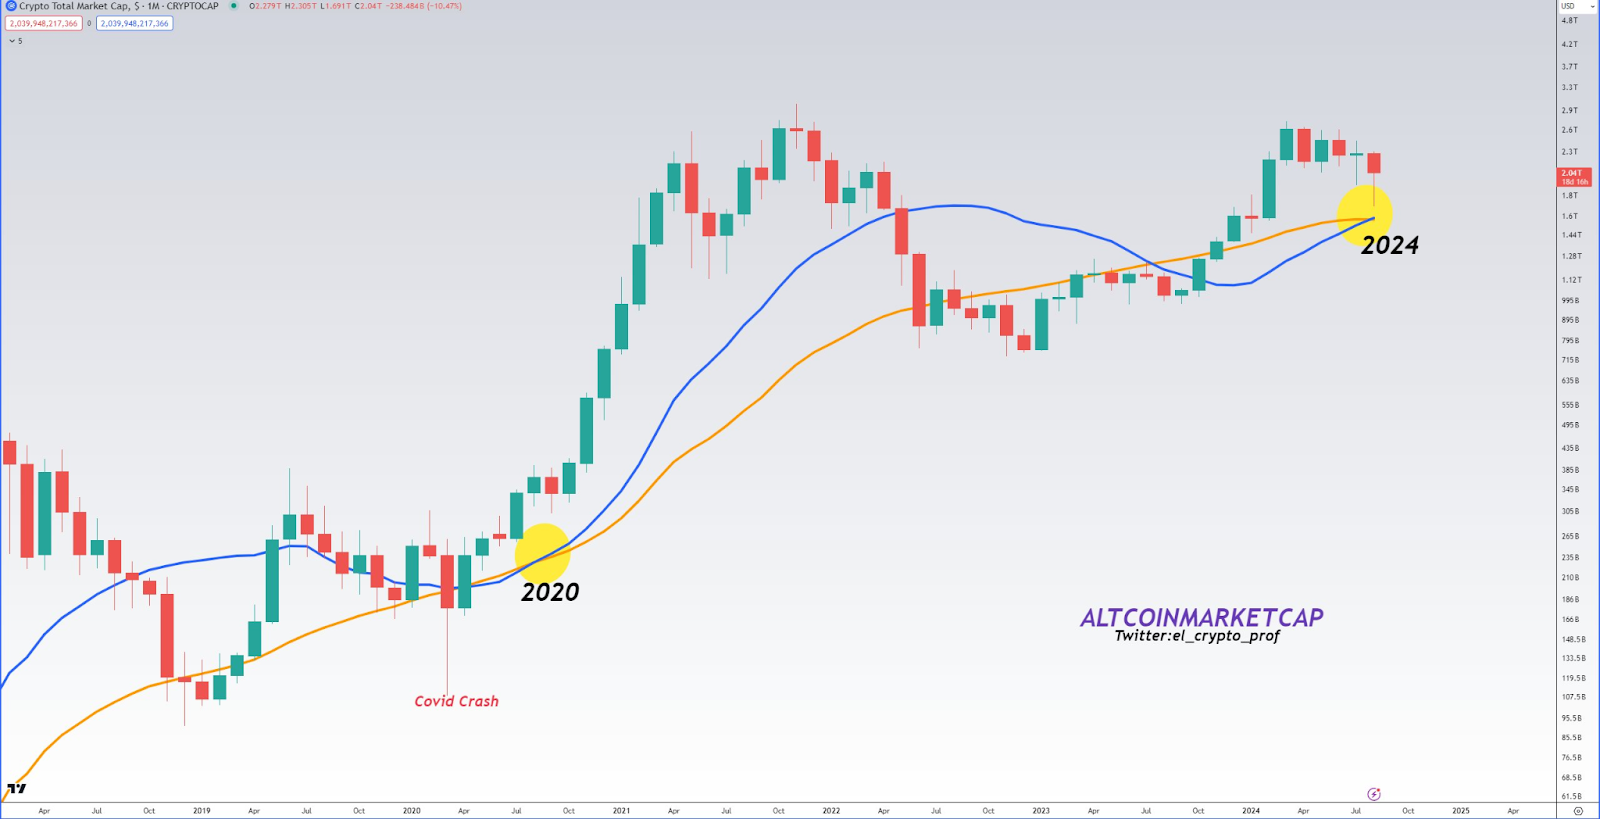
The chart spans from 2017 to mid-2024, showcasing the altcoin market’s evolution over these years. Candlestick patterns reveal the price action, highlighting periods of volatility and consolidation.
Two moving averages are represented: the blue line indicates the 50-month moving average (MA), while the orange line represents the 200-month MA. These moving averages play a crucial role in identifying long-term market trends and potential reversal points.
 Source: @el_crypto_prof on X
In particular, a notable event on the chart is the COVID-19 crash in 2020, marked by a yellow circle. This crash led to a substantial market drop, followed by a strong recovery that continued into 2024.
Another critical point is marked in 2024, where the market appears to approach a crucial level. The convergence of the 50-month and 200-month moving averages at this point could indicate a potential shift in market momentum.

Volatility and Market Behavior
The altcoin market has experienced periods of growth, decline, and consolidation, as reflected in the chart. After the sharp decline during the 2020 COVID-19 crash, the market entered a phase of rapid growth.
This was followed by another drop before consolidating in 2024. Despite these fluctuations, the overall trend has remained upward since 2020, suggesting a long-term bullish outlook for altcoins.
The potential convergence of the 50-month and 200-month moving averages in 2024 could signal a critical point for the market. Market analysts are likely to closely watch it as it may indicate either a continuation of the bullish trend or a possible reversal.
Implications of the Golden Cross
The presence of the golden cross, despite the recent crash, suggests that the long-term trend remains intact. This bullish signal, seen in the total market capitalization, reinforces the idea that the altcoin market could be poised for further growth. The fact that a similar pattern was observed in 2020, just before a market rally, adds weight to this analysis.