- $PUMP jumped 36% after breaking above key trendline and channel resistance, confirming a shift in market sentiment.
- Heatmap shows strong buy support at $0.005 and sell pressure near $0.008, signaling key levels for the next move.
- Golden Cross on the 4H chart signals bullish momentum as price stays above major support at $0.0062.
$PUMP exploded from $0.0060 to $0.0075 in a fiery breakout, gaining over 40% this week. With momentum heating up and bulls in control, eyes are now locked on the $0.0089 target as trading volume and hype continue to surge.
Strong Breakout Confirms Bullish Shift
$PUMP broke out on September 29 after trading in a tight range between $0.0055 and $0.0063.This breakout also cleared a short-term trendline that had capped price for weeks.
Volume spiked as buyers stepped in. The price quickly moved past the channel top at $0.0060 and surged to $0.0075. This 36% rally confirmed the breakout and showed a clear shift in momentum.
According to Alpha Crypto Signal, the breakout happened with clean structure and strong volume support. Now, $PUMP is holding above key support levels, showing buyers remain in control.
The 50 SMA on the 4-hour chart is now acting as support around $0.00618. Price is also testing the 9 EMA near $0.00676. Holding above these levels could lead to more upside.
Order Book Signals Key Price Zones
Order book heatmap from MEXC shows strong buy interest near $0.005. This zone is stacked with limit buy orders, acting as a key support area if price dips.
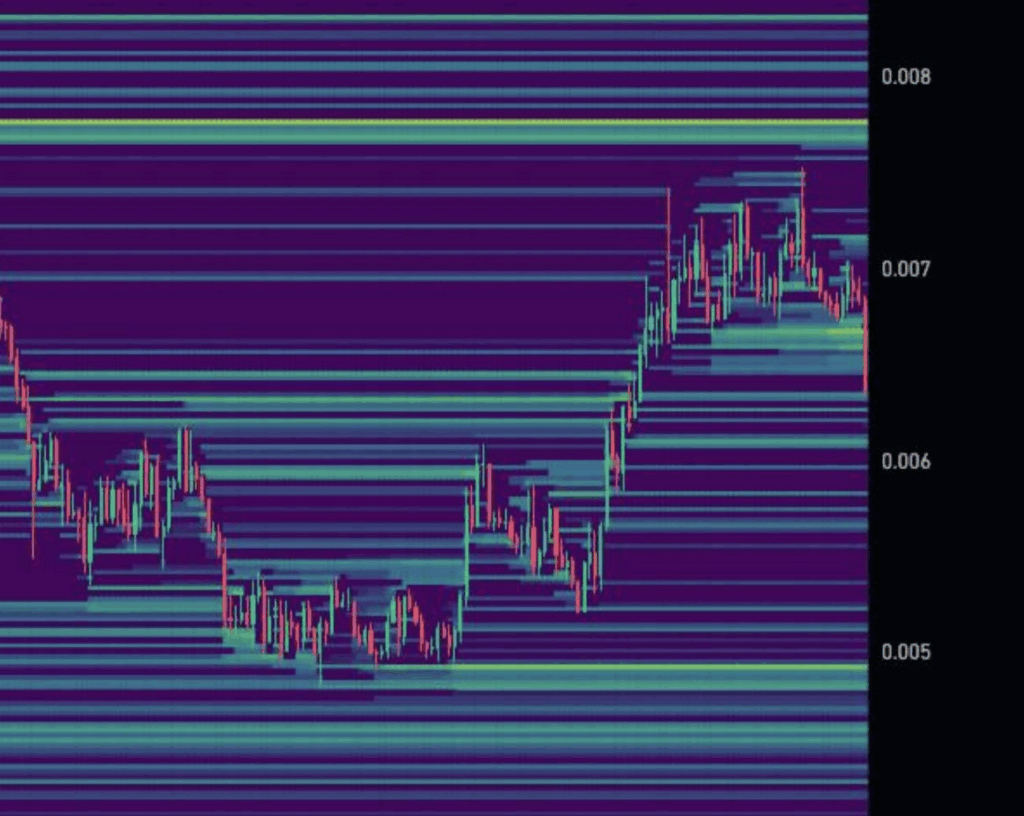
On the upside, sell walls are building near $0.008. This zone may slow down prices unless bulls break through with strong volume.
Liquidity between $0.006 and $0.007 is thin. Price can move quickly in this range due to fewer resting orders, causing sharp up or down swings.
Current order flow near $0.007 shows a balance between buyers and sellers. This may lead to short-term consolidation before the next big move.
Golden Cross and RSI Point to More Upside
The technical outlook remains bullish. On Thursday the 50 EMA crossed above the 100 EMA and a Golden Cross formed on the 4-hour chart.
This pattern often signals strong upside momentum. As long as $PUMP holds above $0.0062, the bullish structure stays intact.
RSI is currently at 62. While not yet overbought, it shows momentum may be slowing. A pullback is possible, but dips could attract buyers again.
If price clears $0.0080, the next major target is $0.0089 — the all-time high.