- Global liquidity inflows signal a bullish phase for BTC, with potential price movements occurring within 6 to 30 days.
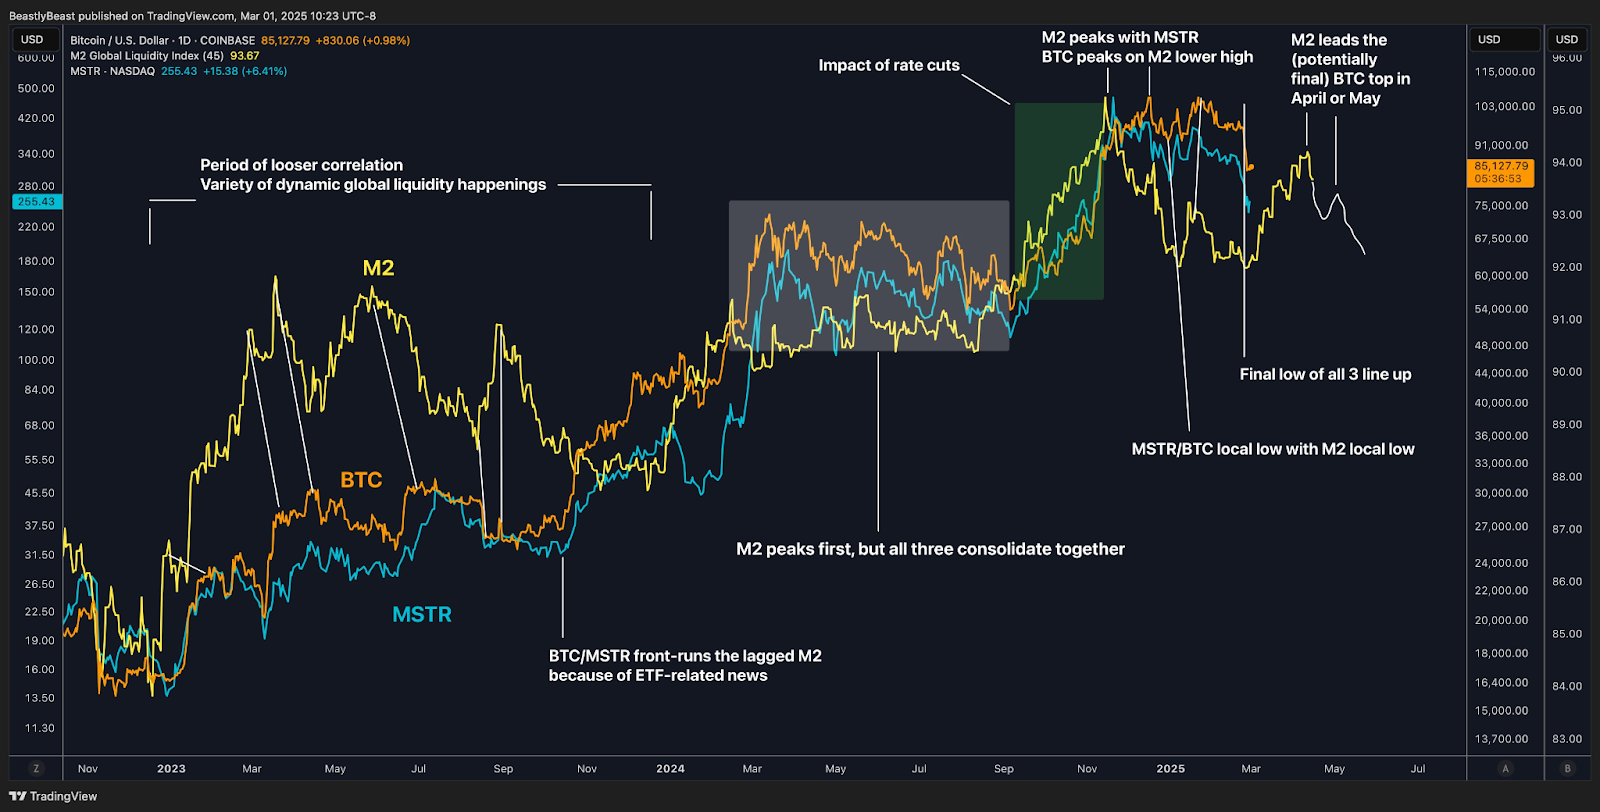
- BTC and MSTR closely follow M2 liquidity trends, with BTC peaking after M2 forms a lower high, reinforcing their correlation.
- BTC’s peak may arrive by April–May 2025, driven by liquidity trends, macro factors, and institutional catalysts like ETF-related news.
A major injection of global liquidity is imminent, with potential effects on Bitcoin (BTC) and MicroStrategy (MSTR) stock prices. Market analysts highlight a strong correlation between BTC, M2 Global Liquidity Index (M2), and MSTR. Depending on the offset period, liquidity expansion could impact markets in as few as six days or extend up to 30 days. Either way, liquidity inflows remain a bullish signal for BTC.
Bitcoin’s Correlation with M2 Liquidity
Historical data confirms BTC’s price movements closely align with M2 liquidity shifts. BTC often peaks when M2 forms a lower high, while MSTR aligns with M2 peaks. This pattern suggests M2’s influence on both assets. Besides, ETF-related news has caused BTC and MSTR to react ahead of liquidity trends. Institutional investors and speculative demand contribute to this divergence.
BTC and MSTR’s recent trends indicate synchronized behavior with M2. During mid-2024, M2 reached a peak, followed by BTC and MSTR. Both assets consolidated before their next move. Hence, monitoring M2 trends is crucial for predicting BTC’s price cycle.
Market Impact of Rate Cuts and Liquidity Trends
Rate cuts influence M2, affecting BTC’s market cycle. When M2 peaks, BTC follows, albeit at a lower high. MSTR, however, aligns more closely with M2’s movements. This pattern suggests that liquidity conditions drive market trends.
Moreover, the data indicates BTC may reach its final peak by April or May 2025. Once M2 declines, BTC and MSTR may follow suit. A synchronized local low for all three metrics further reinforces this correlation.
BTC’s future movements largely depend on M2 trends and macroeconomic conditions. Institutional catalysts like ETF-related news can drive short-term surges. However, the long-term trend remains tied to liquidity injections.