- GALA nears historical lows, testing the crucial $0.01400-$0.01250 demand zone, a potential turning point for price movement.
- RSI at 32.47 suggests GALA might be oversold, while MACD convergence hints at a possible shift in bearish momentum.
- Despite a recent 3.13% price increase, GALA’s low trading volume signals uncertainty in the strength of any trend reversal.
GALA has recently broken below its descending channel, raising concerns about a potential deeper drop in price. Trading on Binance, the GALA/TetherUS pair is nearing its historical low, with the current price resting just above a crucial demand zone at $0.01400-$0.01250.
This level could either provide support, preventing further declines, or, if broken, signal a continuation of the downtrend. Notably, GALA’s price is now approaching a make-or-break point, with no other historical support levels to cushion further drops.
Price Action and Key Support Levels
Since its peak in February, GALA has been in a consistent downtrend, with the price contained within a descending channel formed by two parallel trend lines. The recent break below this channel has led to a retest of the $0.01400-$0.01250 demand zone, a level that now holds the key to the asset’s near-term future.
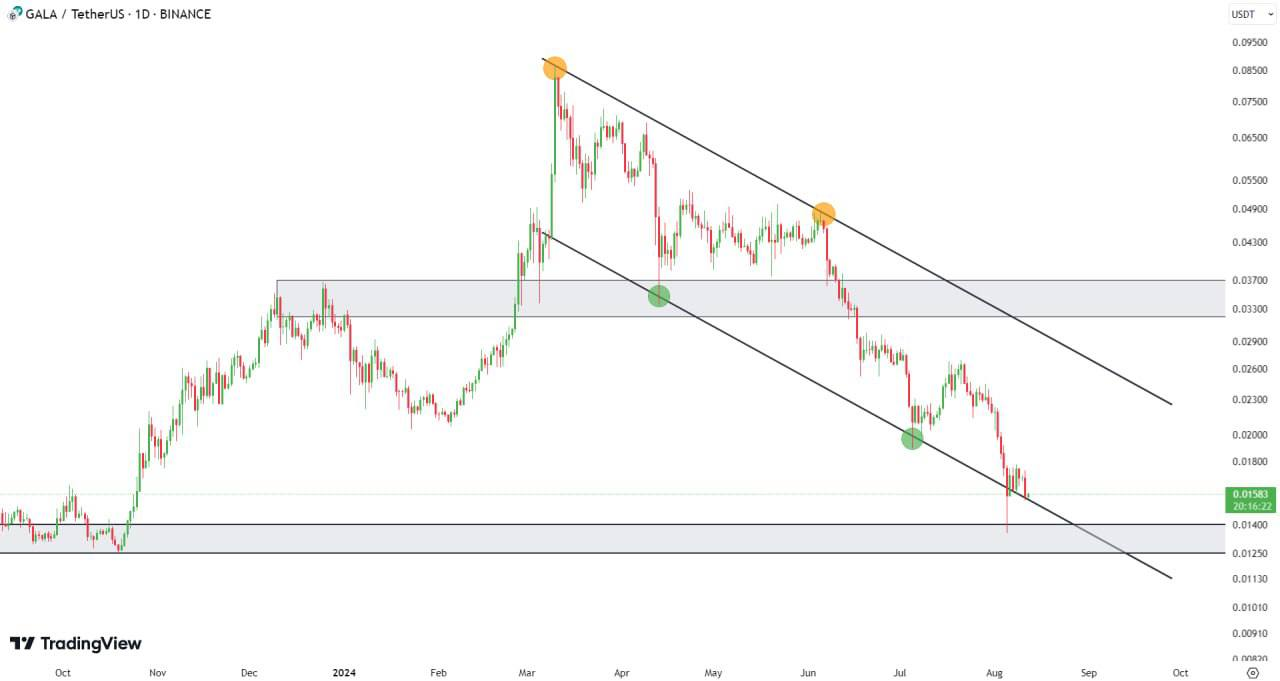
Currently, GALA is trading at $0.01583, a price almost at its historical bottom. If the demand level fails to hold, the market could see a deeper price drop. On the other hand, should this level provide adequate support, there is potential for a rebound, with previous peaks becoming achievable targets in the shortest time.
Technical Indicators Signal Bearish Momentum
The technical indicators further reinforce the bearish outlook for GALA. The Relative Strength Index (RSI) currently stands at 32.47, suggesting the asset is approaching oversold conditions.
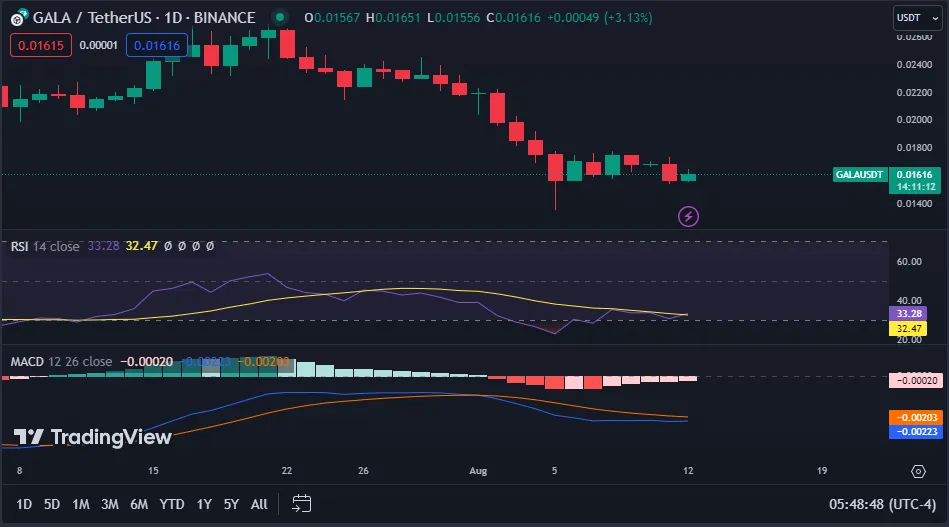
Source: TradingView
Additionally, the Moving Average Convergence Divergence (MACD) indicator shows that both the MACD line and the signal line are below the zero line, indicating ongoing bearish momentum. However, these lines are converging, hinting at a possible shift in momentum.
Recent Market Movement and Volume Analysis
In the past month, GALA’s price action has been dominated by red candles, signaling consistent downward pressure. A small green candle has recently appeared, suggesting a potential short-term reversal, but it remains insufficient to indicate a strong trend change.
The recent price increase of 3.13%, bringing GALA to $0.01616, is notable yet uncertain in its implications. Trading volume has been relatively low compared to earlier periods, which might affect the strength of any upcoming moves. With GALA near its historical low and key demand level, traders and investors should closely monitor the asset’s performance to gauge its next direction.