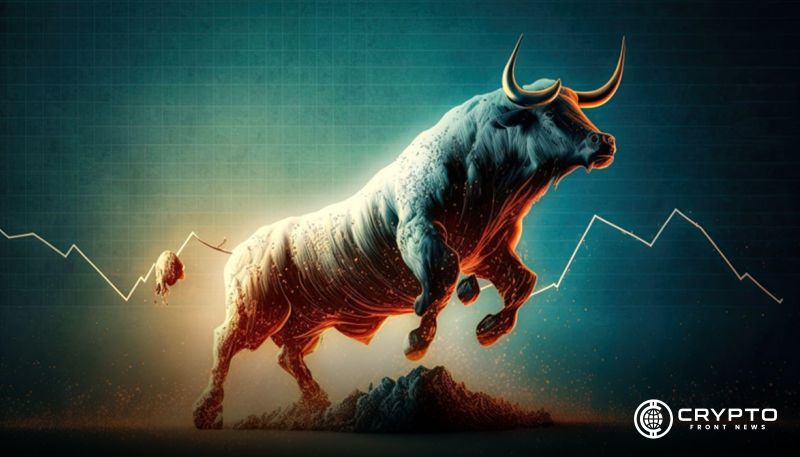

- Fantom (FTM) holds higher lows, signaling strong bullish momentum that could lead to a major breakout and price surge.
- Key resistance levels at $2.00 and $4.87 align with Fibonacci extensions, reinforcing potential upward moves.
- Market structure shifts bullish with higher highs/lows, suggesting an accumulation phase before a major rally.
Javon marks analysis Fantom (FTM) as it shows bullish momentum holding higher lows. This signals an ongoing uptrend that could lead to a price surge. A breakthrough above the $1.45 level may prepare for a rally. Projections suggest an over 200% increase, with the $3.00663 target in sight. However, this may only be a part of an even larger 504% run to reach higher resistance levels.
Market Structure Shifts to Bullish
Initially, FTM experienced a strong downtrend, characterized by a sharp price decline. A descending trendline captured this movement before a reversal emerged. The price established a bottom and started forming higher highs (HH) and higher lows (HL). This shift indicates a potential bullish trend.
Moreover, the market structure now shows successive HH and HL patterns. These formations confirm a steady uptrend, suggesting an accumulation phase. Historically, such consolidations have preceded major price surges.
Key Resistance Levels and Fibonacci Extensions
The current price hovers around $0.51100, below the projected targets. Two resistance levels stand out: the first at $2.00043 and the second at $4.87416. These zones may witness price reactions as buying momentum increases.
Additionally, Fibonacci extension levels align with these targets, reinforcing the likelihood of further gains. The price continues to respect higher low zones, signaling strong demand. The absence of lower lows further strengthens the bullish outlook.
Technical Indicators Support Uptrend
The market’s cyclical character is highlighted by the chart’s impulse and correction waves. FTM is currently retreating from its prior peak and in a corrective phase. The dotted trendline, however, points to a further upward move.
Historically, sharp declines have led to prolonged recovery periods, followed by strong uptrends. Presently, the steady incline suggests changing market sentiment. Besides, previous consolidations have preceded major bullish moves, supporting an optimistic outlook.