- XRP gains renewed institutional attention after Franklin Templeton’s ETF approval while overall market conditions remain shaped by recent multi-day valuation declines.
- Heatmap data shows a dense XRP cost-basis cluster between $1.70 and $2.10, a strong holder positioning zone during mid to late 2025 consolidation phases.
- Short-term trading is showing signs of low volatility and reduced volume as momentum indicators show gradual stabilization after a sharp mid-week downturn.
The XRP ETF approval comes at a moment when the market is tightening, prices are shifting, and institutional interest in XRP is starting to build again.
XRP ETF Approval and Market Reaction
Franklin Templeton’s spot XRP ETF has been approved for listing on NYSE Arca, marking a new entry into exchange-traded crypto products. CEO Jenny Johnson described the ETF as a step intended to draw retirement funds and broader institutional capital toward XRP.
A post by analyst Ali_charts brought the development into discussion along with market structure commentary. The post framed the ETF as part of a wider shift in attention to XRP, especially as price consolidation continues.
Market participants monitored the approval during a period marked by weakening sector-wide valuations. Total market capitalization fell from near $135B to around $113B between Nov 16 and Nov 22. This is reflecting broad sell pressure and cautious sentiment across digital assets.
XRP Cost Basis Clusters and Price Structure
Ali_charts also shared an XRP Cost Basis Distribution Heatmap, noting that roughly 1.80 billion XRP were previously acquired near $1.75. The heatmap shows dense cost-basis clusters between $1.70 and $2.10 through mid to late 2025, forming structural areas where holders last moved supply.
Price interacted with these clusters between September and November 2025, with several dips into the higher-density bands. The pattern points to zones where many holders maintain exposure at similar price levels.
Lighter supply regions above $3 show limited positioning from previous market cycles, leaving future movement in that range reliant on momentum rather than historical supply congestion.
Current Short-Term Action in XRP Trading
The 1-hour XRP/USDT chart reflects drift around $1.92 to $1.93 after a sharp mid-week drop. The structure since Nov 19 has produced lower highs and lower lows, while recent candles show compressed volatility.
Volume has contracted sharply following heavier sell activity earlier. This often appears near consolidation phases when both buyers and sellers reduce activity before the market chooses direction.
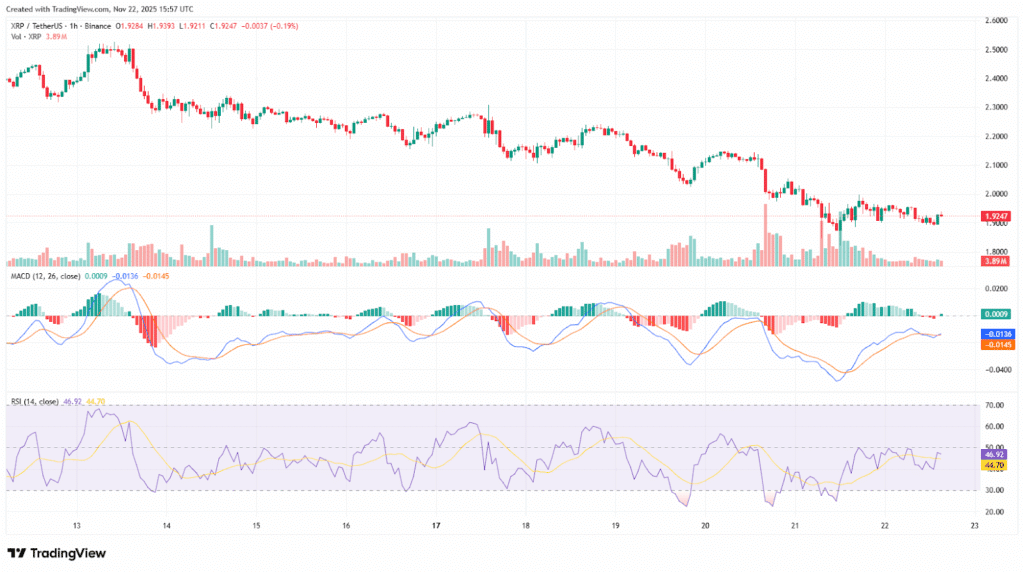
Momentum indicators also show early stabilization. MACD attempts a bullish cross above the zero line, and RSI rises toward neutral at 47, suggesting a market shifting from pressure toward balance as traders watch the $1.97–$2.00 region for renewed strength.