
Amid the recent sharp decline in the price of Floki Inu (FLOKI), crypto analyst Scofield remains optimistic, forecasting a strong rebound that could catch many investors by surprise. Scofield believes FLOKI continues to bolster its fundamentals and is poised to emerge as the leading meme coin in the current bull run.
The analyst’s confidence in FLOKI’s potential remains strong, despite the challenging market conditions, emphasizing that the token’s ongoing commitment to improving its foundation could set it apart from other meme coins.
Scofield’s bullish outlook is grounded in the belief that FLOKI has the strongest fundamentals among its peers. “Floki already boasts the strongest fundamentals of any meme coin, and instead of resting on its laurels, it continues to double down on fundamentals,” Scofield stated.
The analyst further expressed a strong conviction that FLOKI will be the main meme coin of this bull run, a belief that has remained unwavering despite recent price drops.
Adding to the mixed outlook, another analyst, Jelle, pointed out that FLOKI’s price has been hovering around a crucial resistance level of $0.00012789 over the past week.
According to Jelle, a breakout above this key level could potentially trigger a rally of nearly 60%, offering significant upside for those who remain invested in the token.
Jelle’s analysis suggests that while the current market sentiment surrounding FLOKI is largely bearish, there remains a possibility for a strong recovery if the token manages to surpass this resistance point.
Jelle’s perspective adds a layer of technical analysis to the discussion, indicating that the price movement around this resistance level is critical. If FLOKI can break through, it may signal a reversal of the recent downtrend, providing a potential opportunity for investors who are closely monitoring the market.
Current Market Performance and Outlook
Notwithstanding the concept of Scofield and Jelle, the general market perception towards FLOKI continues to be bearish. On August 30, FLOKI traded at an approximate price of $ 0.00015, only to sink to around $0.0001250 in less than a day’s trading timeframe, which was a drop in value by more than 16% in a single day.
This rapid price decrease has occurred over a period when some indicators have simultaneously arrived and there are several such bearish technical indicators which suggest that the outlook in the broad market is neutral at the least if not bearish.
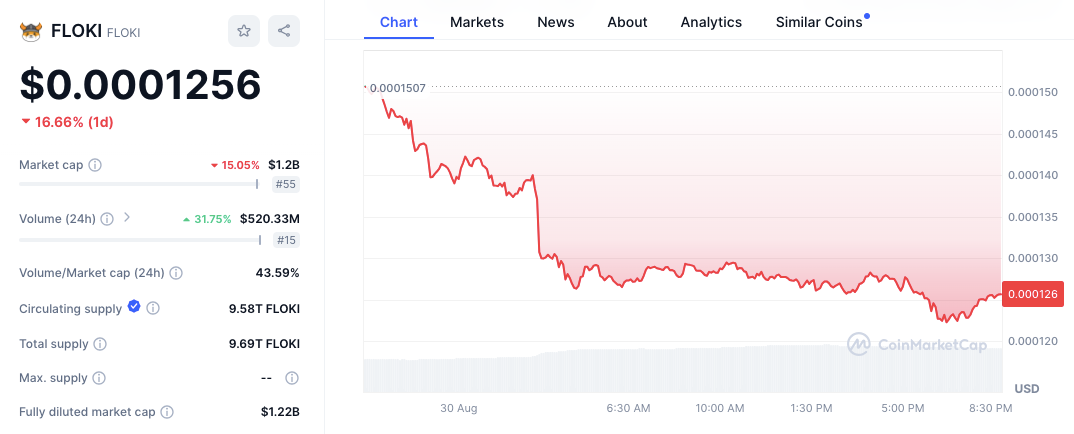
Source: CoinMarketCap
According to the most recent analysis, as of today, the liquidity FLOKI rate is 0.000125 whereas FLOKI price in the last 24 hours has been relatively active with the trading volume of $523,675,298. however, the given token has been of a value 17.75% lower over the last 24 hours and this shows that the market is still currently cautious about the token.
As for now, FLOKI occupies the 55th position in the list of cryptocurrencies available on CoinMarketCap which has a current total market value of $1201299920. Floating supply stands at 9580512560322 FLOKI coins and the max supply is still blank.
The daily trading performance of the FLOKI/USDT pair on Binance reveals substantial volatility throughout 2024. After reaching a peak in March 2024, FLOKI’s price gradually declined, with the most recent sessions showing a sharp drop of over 5%, bringing the price down to 0.00012859 USDT.
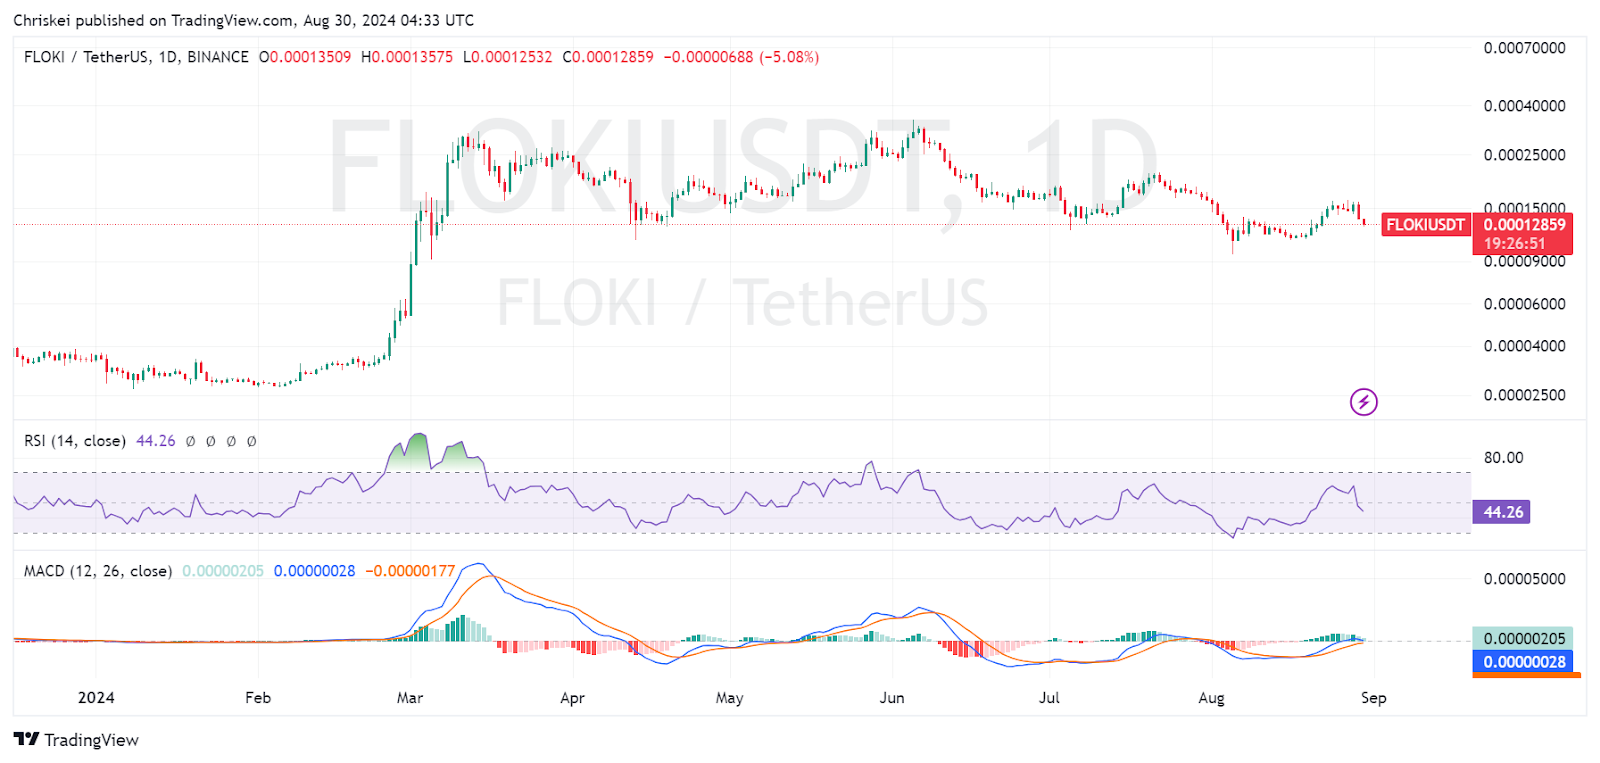
Source: TradingView
The Relative Strength Index (RSI) currently stands at 44.26, indicating that FLOKI is in a neutral zone but with a downward trend that suggests weakening momentum. Additionally, the Moving Average Convergence Divergence (MACD) indicator shows the MACD line below the signal line, with a negative histogram, reinforcing the bearish sentiment.