
- Fetch AI may surge 162% to $3.485, driven by bullish divergences and a breakout above key resistance.
- A breakthrough above $1.2500 resistance could trigger a bullish rally, while failure may lead to further consolidation.
- Positive RSI and MACD signals suggest potential upward momentum, but caution is needed for a possible bearish crossover.
Fetch AI (FET) poised for a potential 162% surge as bullish trends emerge, according to crypto analyst JavonTM1. The analyst highlighted that the token could recover to $3.485, backed by multiple bullish divergences and a breakout from recent resistance levels.
Bullish Momentum Following Initial Rally
From October 2023 to February 2024, Fetch AI saw a sharp upward movement, rising from $0.2000 to around $1.5000. This marked a strong uptrend driven by bullish market momentum. However, after hitting its peak in February, FET entered a period of consolidation. Lower highs and lows formed a descending channel, reflecting market correction.
A notable change occurred when the price broke through the descending trendline resistance around $0.6500 to $0.7000. This breakout indicated a potential shift from bearish to bullish sentiment, suggesting that buyers were regaining control.
Key Support and Resistance Levels
Fetch AI has several notable support and resistance levels. Support is observed at $0.2000, where the initial uptrend began. A more immediate support level lies at $0.9000, a key pivot during the consolidation phase. On the upside, resistance is present at $1.2500 and $1.5000. If the token successfully surpasses these levels, a major bullish move could follow, potentially testing higher price targets.
The price action has been volatile as the token approached the $1.2500 resistance level. A breakthrough at this point would strengthen the bullish case, but failure to break through could result in further consolidation.
Technical Indicators and Momentum
Key momentum indicators signal potential upward movement. The Relative Strength Index (RSI), currently at 60.76, is approaching the overbought zone. While this suggests strong bullish momentum, traders should monitor the RSI for signs of slowing buying pressure.
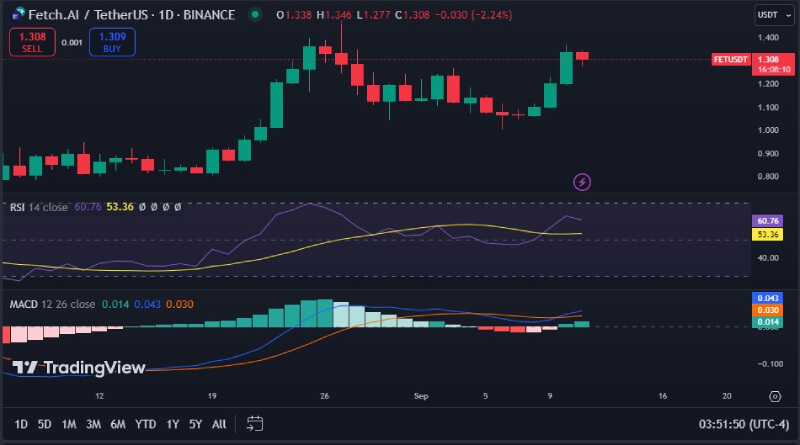
The Moving Average Convergence Divergence (MACD) indicator also shows positive momentum. A bullish divergence between the MACD and signal lines hints at a potential upward move. However, traders should remain cautious of a possible bearish crossover in the coming days.
Overall, Fetch AI is currently at a critical point, and its next movement will depend on whether it can break through key resistance levels or retrace to support zones.