
- FET reclaims key support after triangle breakdown as bullish sentiment returns ahead of the $FET, $AGIX, and $OCEAN merger.
- Technicals show FET forming a base above $0.775 with potential breakout if price clears resistance near the $0.810 zone.
- Elliott Wave count suggests FET is in Wave (5) with upside targets between $2.20 and $2.60 backed by strong structural signals.
Fetch.AI ($FET) reclaimed a critical support zone following a brief breakdown from a symmetrical triangle. This key move has revived bullish sentiment among traders. Alpha Crypto Signal confirmed the asset retested and held this support, validating a risk-managed long setup. The price action aligns with strong fundamentals as the upcoming $FET, $AGIX, and $OCEAN merger draws closer. This confluence of structure and narrative has made $FET one of the most compelling AI tokens in the market.
Source: Alpha Crypto Signal
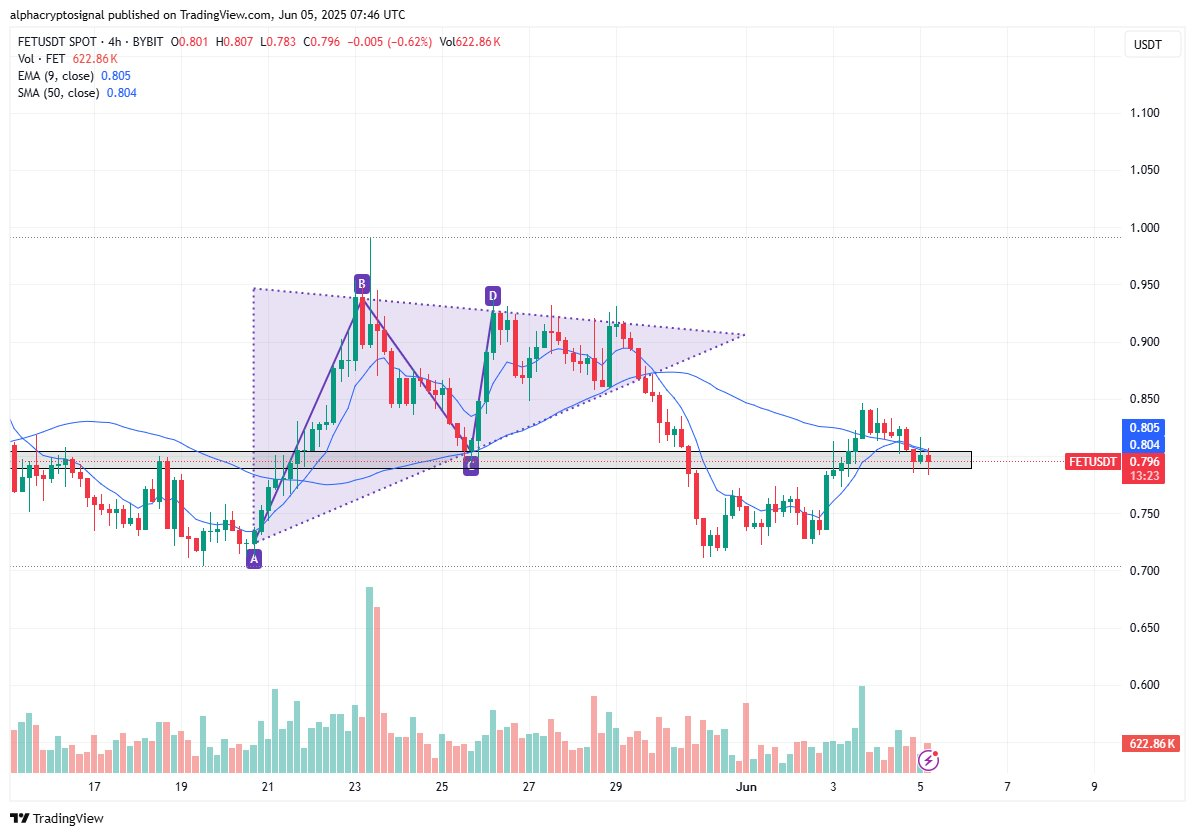
The 4-hour chart on Bybit revealed an ABCD harmonic pattern that completed inside the triangle. Point A began near $0.685, climbing to $0.945 at Point B. A healthy retracement to $0.790 marked Point C, before price advanced to Point D near $0.910. After completing this structure, $FET broke downward, falling below both the 9-period EMA and the 50-period SMA.
Short-Term Compression Builds for FET
Following the breakdown, $FET dropped to $0.745 before bouncing. The recovery lifted price near the $0.850 resistance but failed to sustain above key EMAs. Price hovered in a narrow range near $0.790, showing indecision and moderate volume activity. Sellers rejected attempts to reclaim the $0.805–$0.810 zone, which aligns with both moving averages. Moreover, this resistance continues to cap upward moves, as multiple wicks confirm its significance.
The current support sits near $0.775–$0.780. This zone rests above the last swing low, offering a base for potential upward momentum. While the EMAs remain above current price, further consolidation indicates a potential breakout. A move above the $0.810 region could spark another leg up.
Wave (5) Confirms with Target Set at $2.60
Meanwhile, Elliott Wave analyst Hov identified $FET as being in Wave (5) of its five-wave cycle. Wave III topped at $3.20 in March 2024, followed by an eight-month correction. Wave IV bottomed around $0.40, completing a textbook retracement.

Source: Hov
Consequently, the breakout above triangle resistance confirms Wave (5) is now underway. Price targets for this wave range between $2.20 and $2.60. Additionally, these levels align with historical resistance zones, adding further weight to the projections.