
- FET price breaks above mid-channel resistance and key EMAs, signaling a bullish shift.
- Volume uptick and MACD crossover confirm early signs of upward momentum.
- Holding above $0.62 could trigger a move toward $0.65 and $0.70 supply zones.
Fetch.ai (FET) is making waves today, climbing 2.2% to $0.6178 on strong volume. After breaking out of its long-held descending channel, FET is showing renewed momentum, with buyers setting their sights on higher targets as bullish signals start to align.

Breakout Above $0.62 Signals Shift in Momentum
FET has broken above its long-standing descending channel, ending a bearish streak that lasted since mid-August. The breakout took place just above the $0.61 resistance—precisely where the mid-channel level and the exponential moving average (EMA) converged.
Price action has closed confidently above both the 9-period EMA ($0.609) and the 50-period simple moving average (SMA) at $0.611. This short-term bullish crossover indicates a clear momentum shift in favor of buyers.
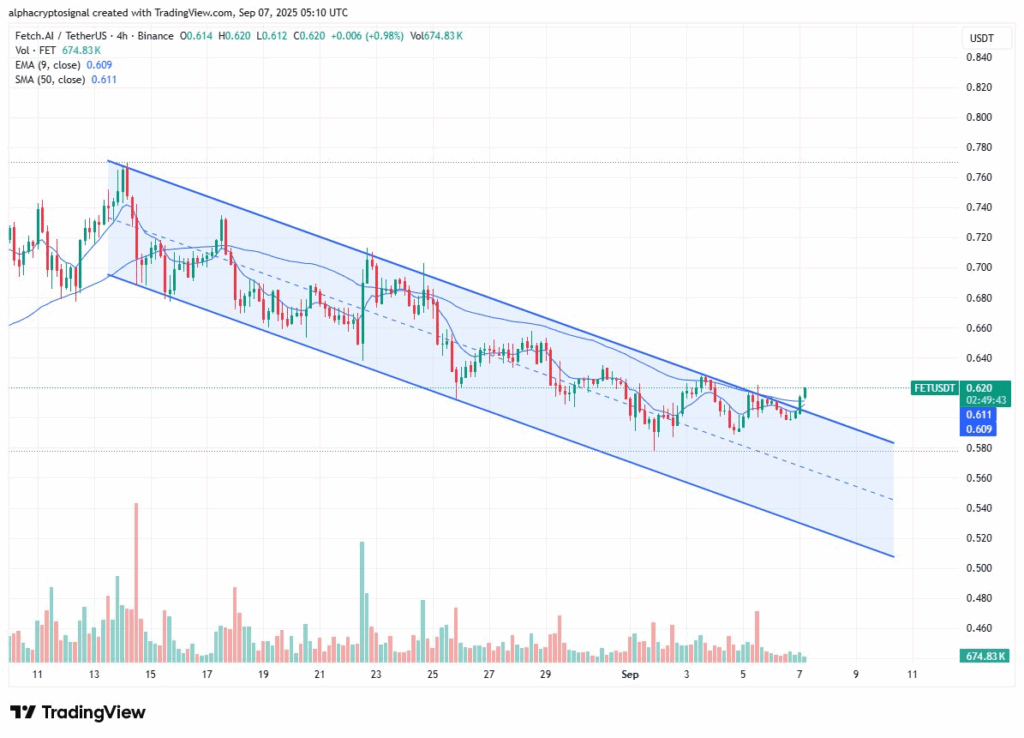
The breakout was confirmed by a green-bodied candlestick accompanied by increasing volume—about 674.83K on the 4-hour chart. This signals real buyer participation rather than a speculative spike. If buyers can keep the price above $0.62, resistance is at $0.66.
Technical Signals Growing Momentum
The volume trend offers further confirmation. Over the past few sessions, volume has steadily risen, peaking at 3.22 million—indicating growing interest in FET’s reversal potential. A sustained increase here would provide stronger footing for the current move.
RSI is also trending positively, rising from sub-40 levels to 57.86. While not yet overbought, this level shows rising buying strength without reaching exhaustion. A break above 60 could ignite more aggressive buying.
The MACD is showing early signs of strength, with a fresh bullish crossover as the MACD line moves above the signal line from below zero. The histogram turning green adds to the momentum, suggesting FET could be entering the early phase of a trend reversal.
Market Cap Rebounds as Bulls Re-Enter
Market cap data from CoinMarketCap reflects this shift in sentiment. After dipping below $1.38 billion on September 2, FET’s market cap formed a double-bottom near $1.40 billion. A strong recovery followed, reaching nearly $1.47 billion by September 7—mirroring the price breakout.
This trend suggests investors are gradually rotating capital back into the project, supporting the technical setup seen on the charts.