
- Ethereum’s OBV trend is inside an ascending channel, with levels holding near 12.87M despite minor pullbacks.
- Analyst ZYN notes a bullish cross, noting past patterns led to 60% and 24% gains in July and August.
- Volume and price moves align as higher lows in OBV show steady accumulation and continued market demand.
Ethereum’s market momentum is under focus after analysts noted strengthening On-Balance Volume (OBV) trends and a newly formed bullish cross. The asset’s OBV has held inside an ascending channel since August, suggesting continued buying activity.
Meanwhile, historical data shows that earlier bullish crosses in July and August led to significant price surges. These factors are driving speculation about Ethereum testing levels above $5,000 before the month ends.
OBV Holds Steady in Ascending Channel
Between June and mid July, OBV fluctuated between 10.0M and 10.8M, indicating a muted momentum during that period. However, a breakout in late July marked a decisive shift, lifting OBV from around 10.8M to nearly 13.0M by early August.
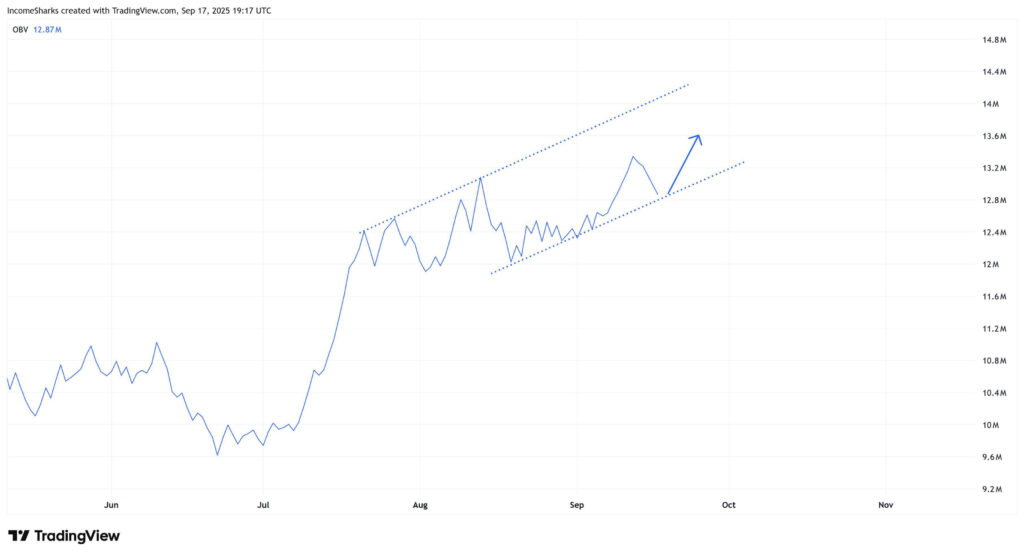
This sharp rise indicated strong accumulation, supported by consistent demand in the market. Since that surge, OBV has remained within a rising channel between 12.4M and 13.8M.
Current levels are near 12.87M, just above mid range support. Despite brief pullbacks, the channel structure is intact, reinforcing steady accumulation. If the trend persists, OBV could retest the 13.6M–14.0M zone in the near term.
Bullish Cross Pattern
Analyst ZYN noted that Ethereum has just formed another bullish cross, a pattern previously linked with sharp upward movements. In July, the asset rallied 60 percent following the same pattern, and in August, it gained 24 percent. Based on this history, ZYN suggested that another surge could place Ethereum above $5,000 before the month concludes.
This perspective aligns with OBV’s rising channel, as both indicators suggest ongoing bullish momentum. However, maintaining the OBV support near 12.4M remains crucial for sustaining this outlook.
Volume and Price Moves Align
The alignment between volume based indicators and price action shows how demand continues to outweigh supply. The higher lows within the OBV channel reflect persistent accumulation, while repeated tests of higher levels demonstrate ongoing upward pressure.
Ethereum currently trades with this range, where both OBV and technical crossovers point to further potential gains. While the bullish cross offers a price outlook, the OBV structure provides a volume-based confirmation. These factors show the close relationship between price and trading activity in Ethereum’s recent movement.