
- Ethereum’s MVRV Momentum shift suggests a possible market reversal, historically aligning with major price movements.
- Ethereum’s price hovers near the $2,900 support zone, with RSI at 37.31, hinting at potential recovery if historical trends hold.
- A descending trendline signals bearish pressure, but key support at $2,174.54 could provide a strong foundation for a rebound.
Ethereum’s latest MVRV Momentum shift has drawn attention, signaling a potential market turning point. Ali, a prominent analyst, observed a historical trend where changes in MVRV Momentum often coincide with critical Ethereum price movements. The latest momentum shift makes it crucial to monitor Ethereum’s price action in the coming days.
MVRV Momentum and Ethereum’s Market Behavior
The 180-day MVRV Momentum Oscillator keeps an observant eye on Ethereum’s price movements as compared to market value. The historical extension finds that shift oscillators seldom move against price action.
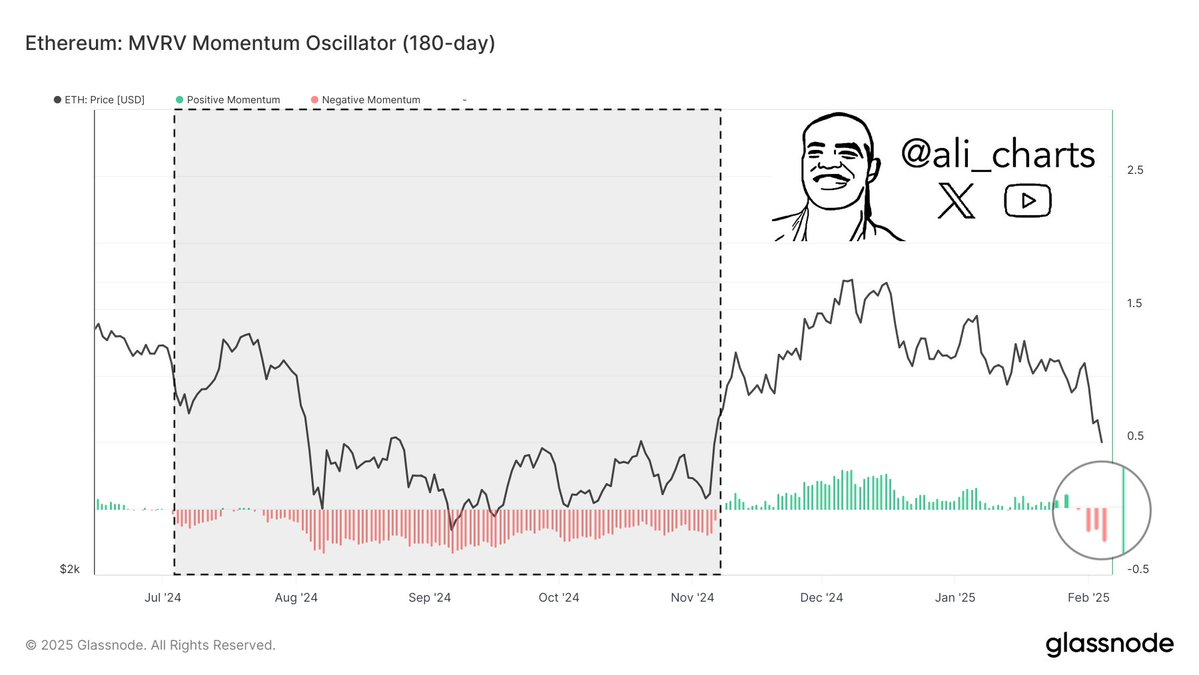
A downward move in August 2024 is predicted as mid-2024 and early-2025 price action close to $2,000. Extended negative momentum has been seen over the period. Weak price action characterized by lower highs and lower lows persisted for months.
However, a reversal occurred in November 2024 as Ethereum surged sharply. The shift to positive momentum, indicated by green histogram bars, coincided with an uptrend. This bullish phase extended through December 2024 and January 2025. Ethereum’s price stabilized and consolidated near its peak, showing minor fluctuations before a pullback in early February 2025.
Technical Indicators and Key Support Levels
Ethereum’s price action against Tether (USDT) in a 3-day timeframe reveals significant levels. The asset recently traded at $2,702.71, marking a 3.07% daily decline. A descending trendline confirms continued lower highs, signaling bearish pressure.
Historically, Ethereum peaked above $4,800 before a major correction. Support emerged at $2,174.54, where Ethereum formed multiple higher lows. A strong rally followed, pushing the price beyond the critical $2,900 resistance zone. This level transitioned from resistance to support after multiple tests.
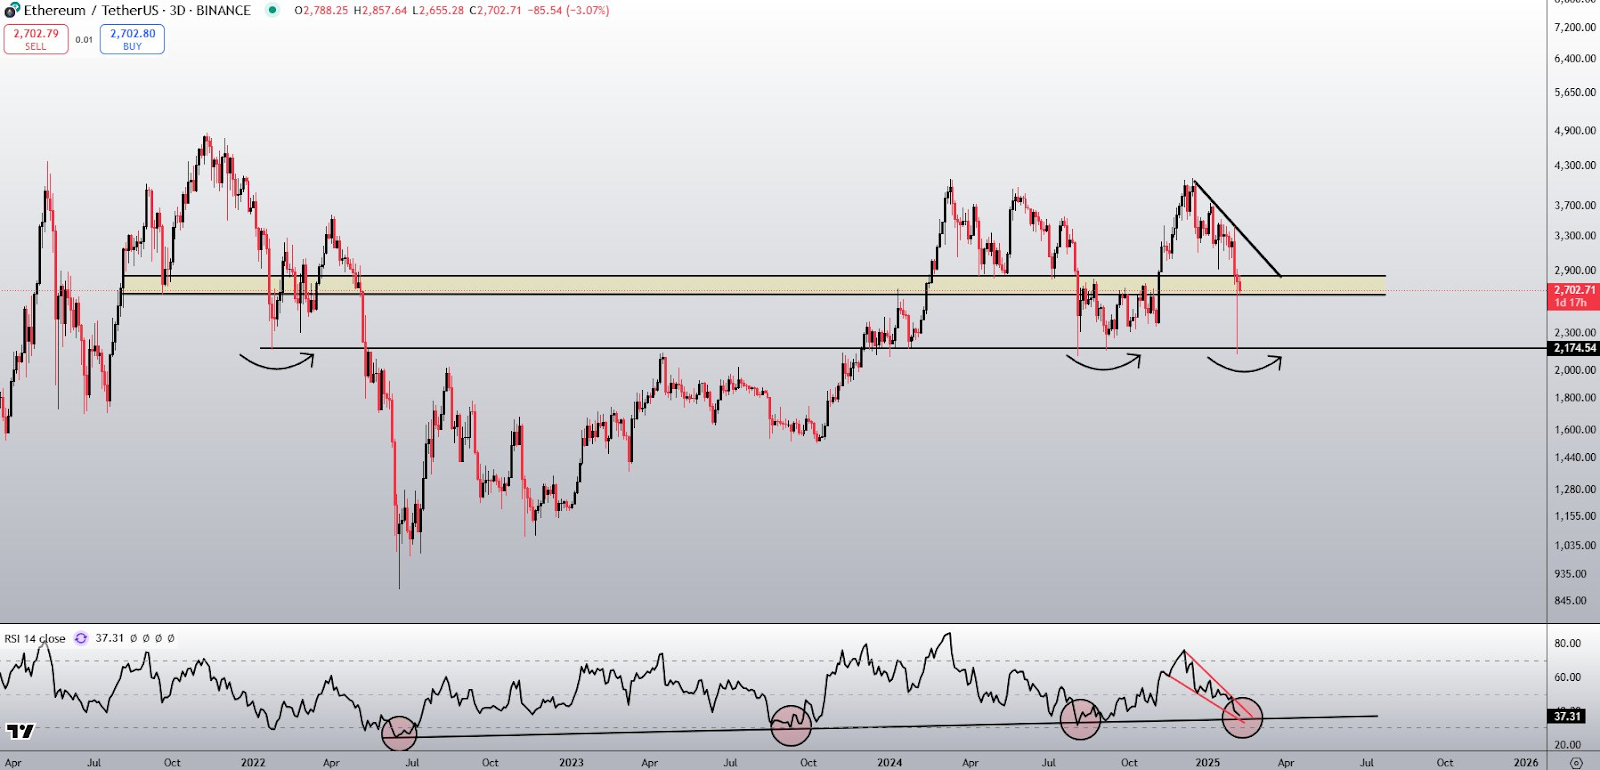
Ethereum’s local high exceeded $4,000 before retracing. The price now hovers near the $2,900 support zone, dipping slightly below before rebounding. The RSI, currently at 37.31, indicates weakening momentum. Historical data shows RSI levels near 30 often precede price recoveries.