
- A new whale wallet accumulated $49.5M in ETH, signaling strong confidence despite Ethereum’s recent price struggles.
- Ethereum remains below the 50-day EMA, facing resistance at $3,000 while finding support near $2,700 amid market uncertainty.
- Exchange netflow shows Ethereum outflows dominating, indicating accumulation as traders move assets off exchanges during rallies.
According to Sport on Chain, a newly created wallet, identified as “0x3ac,” made a massive $49.5 million Ethereum purchase. It acquired 17,695 ETH at an average price of $2,798, using 49.52 million DAI. The wallet initially received 0.994 ETH from Tornado Cash and stablecoins from an unknown multi-signature wallet. This accumulation suggests strong interest in Ethereum despite its price decline.
Ethereum Struggles Below 50-Day EMA
Ethereum price fell by 3.88%, closing at $2,709.8. Price initially touched a high of $2,819.4 before falling below the 50-day Exponential Moving Average (EMA) of $2,956.5. It shows resistance near the EMA, where the breakout couldn’t be held. Support is evident around $2,725.1, indicating buying interest at this level.
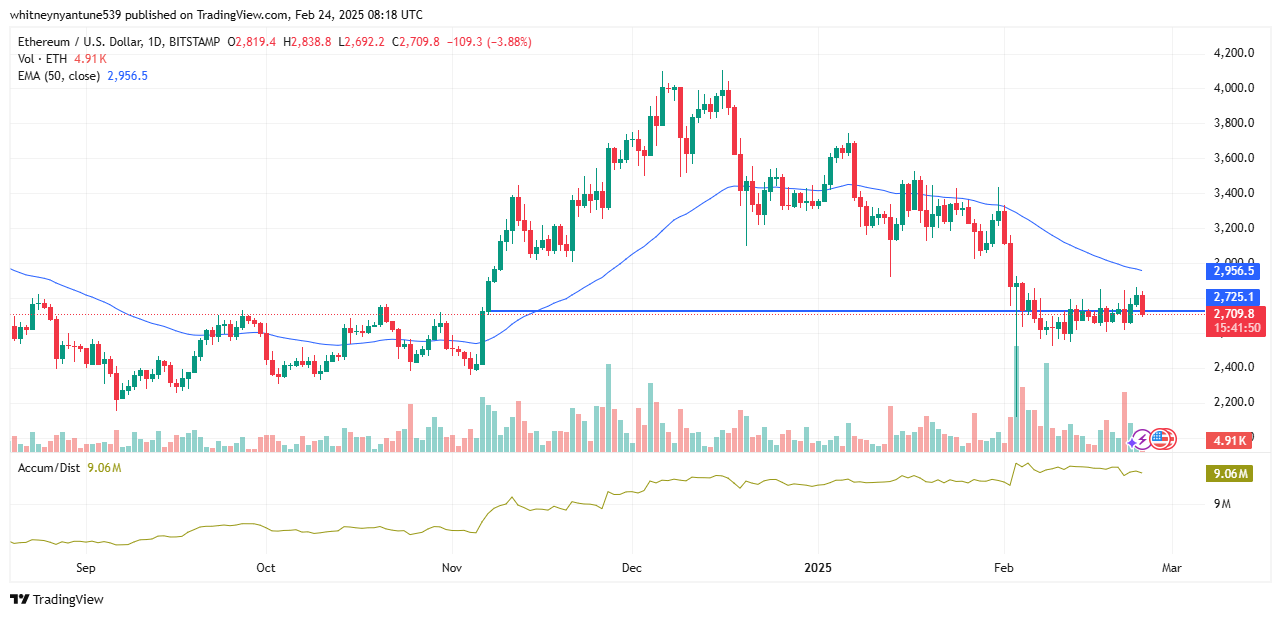
Ethereum’s previous rally peaked near $4,200 before entering a downtrend. Since then, lower highs and lower lows have dominated its movement. The volume currently stands at 4.91K, reflecting a slight increase in activity. The Accumulation/Distribution (A/D) indicator is at 9.06 million, showcasing underlying buying and selling pressure.
Market Consolidation and Exchange Netflow Trends
After experiencing a steep drop since early February, Ethereum is still in a consolidation period. Support is still at $2,700, but there is still strong resistance at $3,000. This small range of price fluctuations highlights traders’ uncertainty. Rekindled bullish momentum might be indicated by a rise over the 50-day EMA. On the other hand, a fall below $2,700 might lead to more drops.
More Ethereum is leaving exchanges than arriving, according to exchange netflow data. Strong accumulation phases are suggested by the predominance of negative netflow. While inflows rise during corrections, large outflows frequently accompany price rises. According to this pattern, traders move Ethereum back on exchanges during downturns and off during rallies.
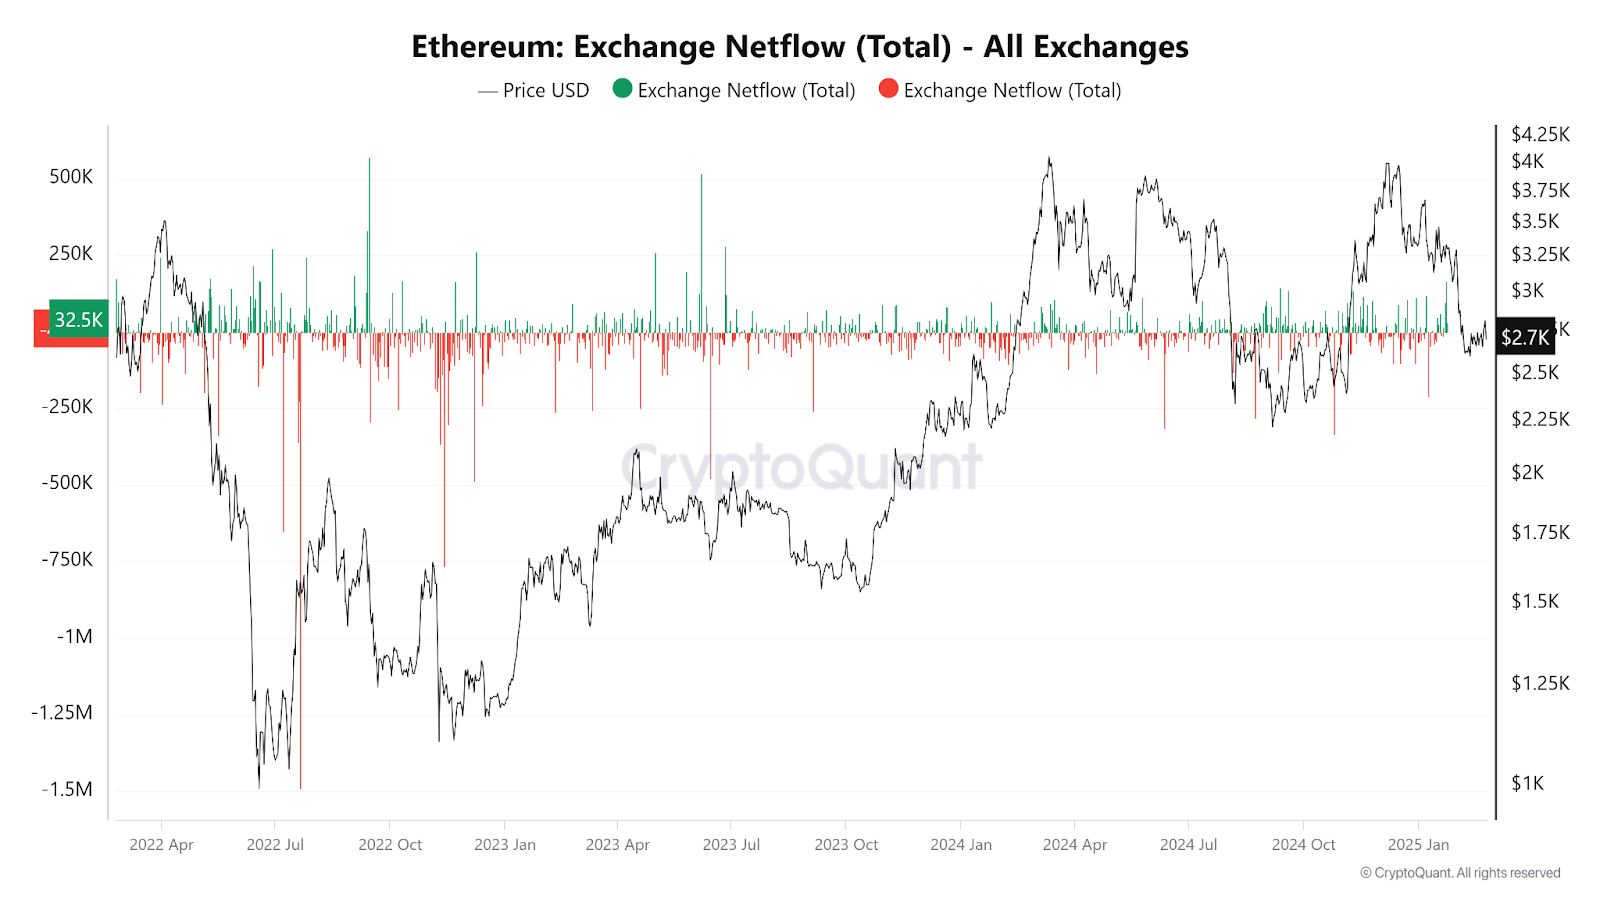
Ethereum’s price history shows volatility between 2022 and early 2025. A sharp fall occurred in mid-2022 with subsequent consolidation. A gradual improvement began in early 2023, continuing into 2024 with new highs before the pullback. In early 2025, Ethereum is sitting at about $2,700.