
- Ethereum’s slide to $3,891 has raised alarms, but oversold signals and support near $3,600 hint at buyers preparing for a rebound.
- After rallying to $4,800 in August, Ethereum now defends crucial support zones that could shape whether momentum returns in coming weeks.
- Analysts stress that despite heavy volatility, Ethereum’s current support region is strong enough to anchor stability before another upward push.
Ethereum is under intense market pressure, sparking debate about whether the correction has run its course.

According to the latest data, Current trading shows ETH at $3,891.81, down 6.34% in a single day. This pullback comes after Ethereum touched highs above $4,100 earlier this month.
According to analyst Sykodelic on X, the current drop could actually mark the bottom. He noted, “Ok now the bottom is in for $ETH. 1D RSI now most oversold since April $1,350 bottom. Funding most negative since Tariff drops. Added to my long. This is not an area you want to short. Much higher soon.” His view reflects mounting optimism that selling exhaustion has already taken shape.
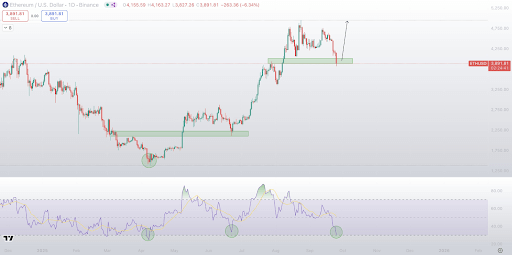
Daily Chart Signals Exhaustion
Ethereum’s 2024 journey has been full of swings. Prices began near $2,300 in January, then consolidated before breaking higher in March. Moreover, a strong accumulation zone between $2,000 and $2,600 laid the foundation for a rally. By May, ETH pierced the $4,000 psychological barrier.
However, markets soon struggled near the $3,800 to $4,200 resistance zone. Several rejection attempts capped the rally, forcing Ethereum into correction. Before rising again in September, the coin tested the $2,800 support by the summer.
Prices increased gradually, recovering $3,000 and reaching $3,900 in October. However, there was an increase in volatility, with daily swings going above previous consolidation areas.
Weekly View Shows Key Support
Besides short-term weakness, the bigger picture offers crucial insight. Analyst Sun Liao highlighted the importance of the weekly chart. He stated, “$ETH I think this region is extremely strong weekly support for Ethereum, because it coincides with both the gold and purple level (previous resistance). Probably won’t close below IMO.”
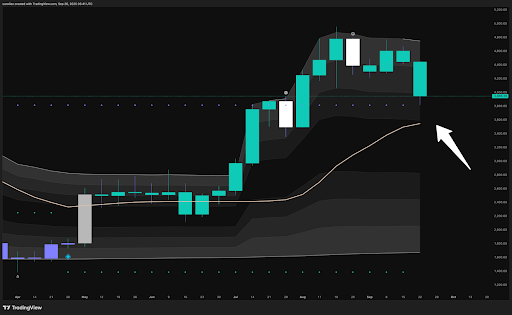
Ethereum’s weekly performance since April 2025 confirms his argument. The market advanced from $1,800 in April to a $4,800 peak in August. However, correction set in, with September finding support around $4,000. Current October declines now test the $3,600 zone, a level aligned with Liao’s highlighted support.
Consequently, both short and long-term signals now converge on the same conclusion: Ethereum is testing pivotal support zones.
Ethereum’s correction has drawn mixed reactions, yet key analysts argue strong support remains intact. Holding these levels could decide the next breakout.