
- Ethereum’s price tests $2,350 support, a crucial level for a potential recovery toward the $3,000 resistance zone amid market fluctuations.
- The MACD indicator signals bearish momentum, with the MACD line at -174.04 and RSI at 37.20, indicating weak buying pressure near key support.
- A breakout above $2,350 could push Ethereum higher, targeting resistance at $3,000 and $3,800 if demand strengthens in the coming sessions.
Ethereum is testing a critical support level as it moves within a parallel channel. The asset’s price action is focused around $2,350, which serves as an important level for potential recovery. A successful move above this threshold could lead to a significant rebound, with targets set between $3,000 and $4,000.
Ethereum’s Current Price Action
According to analysis by Ali Charts, Ethereum’s price chart shows fluctuations over the past year, reaching peaks above $4,000 before declining sharply. The price dropped below $2,250, touching support near $2,135 before rebounding. Resistance is seen around $3,000, with another level near $3,800.
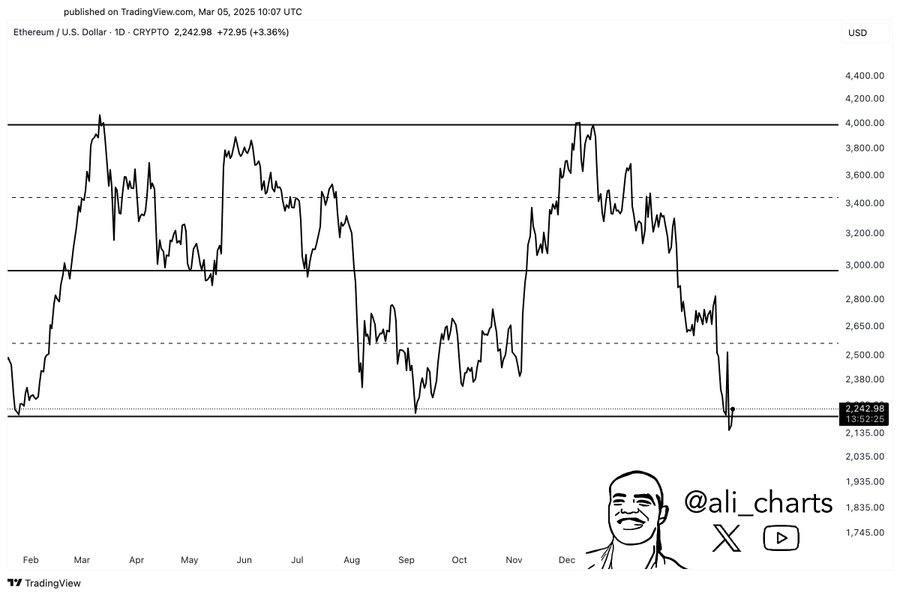
The market recently experienced volatility, with a strong decline followed by a recovery attempt. The asset has been trading within a defined range, with the lower boundary acting as a key support level. Ethereum’s ability to stay above this range remains crucial for any upward momentum. If buyers reclaim control at $2,350, a stronger move toward higher price levels could follow.
Potential Recovery Scenarios and Market Insights
According to TradingView data, the Ethereum (ETH) chart shows bearish momentum, with the MACD histogram at -15.83 and both the MACD line (-174.04) and signal line (-158.21) below zero, indicating downward pressure. The RSI stands at 37.20, nearing the oversold zone, suggesting weak buying strength.
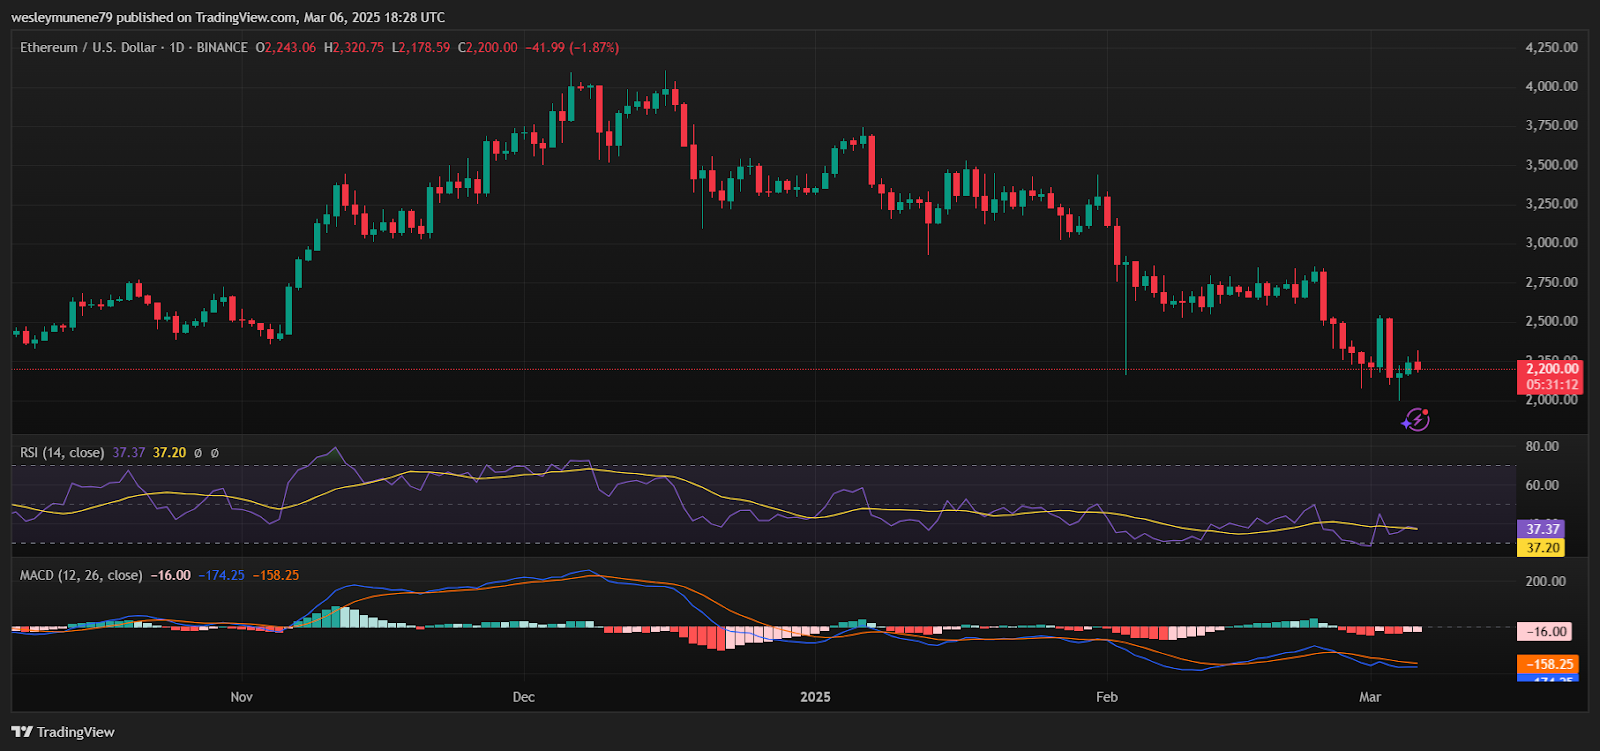
If RSI drops below 30, ETH could see further declines. However, if RSI rebounds above 40 and MACD lines cross bullishly, a short-term recovery is possible. Support lies near $2,000, while resistance is around $2,500.
Breaking above the $2,350 would generate enough buying pressure for the path to the higher ground to be opened. Again, going a level beyond may be used by technical analysts to signify a change of trend.
This particular price area is important since the asset has previously responded to it in some way with trading. If the reclaim is successful, Ethereum could reach the $3,000- $4,000 symbol. Implementing the move would entail market demands and positive market conditions.