
- Ethereum retests $3,200 support, echoing 2017 and 2020 breakout structures before rallies.
- Whales buy 210,000 ETH worth $862M as long liquidations hit $490M during market pressure.
- ETH sees record $3.24B weekly inflows, signaling strong liquidity and institutional interest.
Ethereum (ETH) has entered a crucial phase, with current patterns showing a breakout followed by a retest. Historical data confirms that Ethereum often forms such structures before recording strong upward rallies. These phases have been observed across multiple cycles, setting the stage for potential parabolic moves. At the time of writing, Ethereum was trading at $3,981.

Breakout and Retest Structure
According to an observation by Javon Marks, ETH has broken out and is undergoing another retest phase. Past cycles show that these retests have occurred before Ethereum recorded sharp upward rallies.
In 2017, the asset broke resistance, retested support, and then climbed more than 350% to new highs. Similarly, in 2020, Ethereum formed a retest phase before surging beyond $4,800. The present chart indicates a retest near $3,200, consistent with earlier structures.
Long-term trendlines drawn since 2018 remain intact, keeping Ethereum inside an upward channel. Historical data shows these retests serve as consolidation phases, strengthening support before parabolic advances. Market movements confirm Ethereum is still posting higher lows during pullbacks, suggesting that buyers are defending critical zones.
Market Data and Buying Interest
According to Coinglass data, Ethereum recorded over $490 million in long liquidations during a recent decline. However, whale activity has remained strong. Lookonchain reported that ten wallets accumulated more than 210,000 ETH worth $862 million in a single day. This occurred while the market was under pressure, pointing to strong accumulation trends.
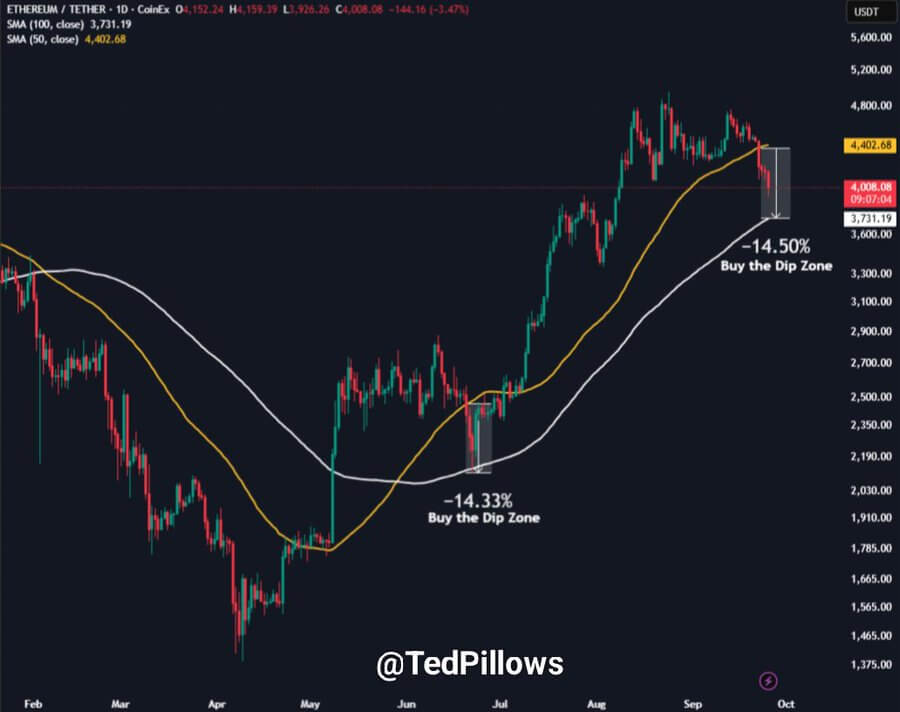
Ted Pillows noted that Ethereum has corrected by 14.50% from recent highs, entering what he identified as a potential “buy zone.” The 100-day simple moving average is positioned at $3,731, while the 50-day SMA remains higher at $4,402. Ethereum experienced a similar 14.33% correction in May before rebounding to higher levels.
Data from DeFiLlama revealed weekly net inflows of $3.24 billion, the highest ever recorded for Ethereum. This surge included a $2.7 billion single-day spike, reflecting liquidity growth within the network. Combined with strong staking figures and institutional ETF inflows, market data continues to point toward conditions that may support Ethereum’s next rally.