
- Ethereum forms a recurring breakout pattern, stabilizing above $3,200 after completing a correction.
- Whale accumulation grows as large holders buy over 394,000 ETH amid ongoing ETF outflows.
- If support near $3,100 holds, Ethereum may retest $3,750 and $4,250, continuing its bullish rhythm.
Ethereum (ETH) has displayed a recurring technical setup resembling its earlier breakout structure, signaling a similar market phase as previous bullish runs. The current chart setup shows that Ethereum has completed a correction around the $3,200 region and is stabilizing above support. The pattern mirrors the same setup that preceded a strong breakout from $2,400 to $4,500 earlier in its trading history. At the time of writing, Ethereum was trading at $3,381.
Ethereum Chart Patterns and Technical Structure
According to analysis prepared by Pepesso, the Ethereum chart presented two comparable structures showing similar breakout and correction formations. The earlier setup recorded a breakout above $2,400, leading to an advance toward $4,559.71.
The new formation is shaping up around $3,200, price change has reversed in the lower zone and it is approaching the same trendline that served as resistance ahead of last breakout. The comparative pattern shows a similar rhythm between correction, consolidation, and recovery phases.
Technical projections place the next upward target near the $10,000 region if market structure repeats its historical pattern. This perspective is backed by repeated price formations and flattened trading seen on daily and multi-day periods. Analysts noted that Ethereum continues to show alignment between current and historical market structures.
Market Activity, ETF Movements, and Long-Term Outlook
According to data from SoSoValue, Ethereum ETFs recorded a sixth straight session of outflows totaling $119 million on November 5. BlackRock’s ETHA led the withdrawals with $147 million in outflows, while inflows from Grayscale, Fidelity, and 21Shares partially offset losses. Cumulative outflows reached $938 million over six sessions, matching Ethereum’s weekly decline of 14%.
Despite ETF pressure, on-chain data from Lookonchain showed strong whale accumulation. Large holders collectively purchased around 394,682 ETH worth $1.37 billion within three days. This accumulation followed recent price dips, indicating strong activity among institutional wallets.
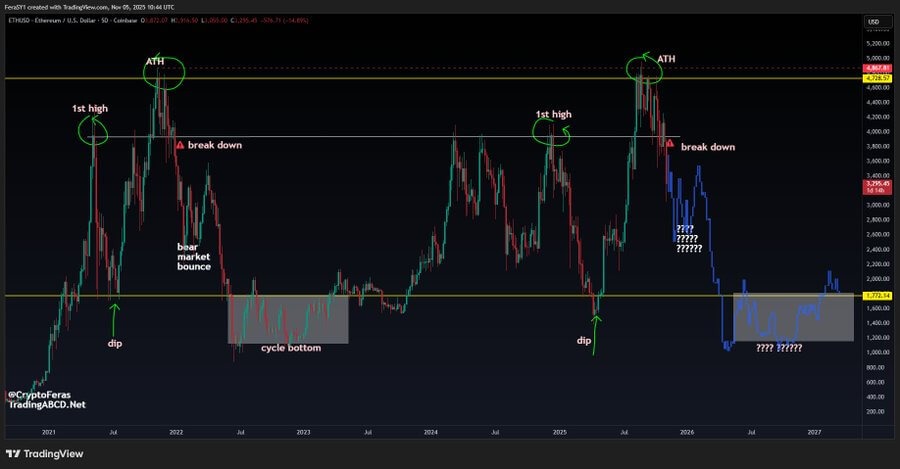
According to an observation by Crypto Feras, Ethereum’s structure still follows a repeating multi-year pattern, where similar cycles included an all-time high, breakdown, and cycle bottom before recovery. Analysts observed that if Ethereum maintains support near $3,100, it could retest $3,750 and possibly $4,250 as momentum strengthens.