
- Ethereum bounced from $1,550 and is regaining strength near $2,488, reclaiming key trend support seen in past bull cycles.
- Weekly MACD shows a bullish crossover as Ethereum attempts to break past $2,500, with momentum shifting after a steep flush.
- Ethereum’s recovery from wedge breakdown mirrors previous cycle resets, setting up a potential move toward $2,700 and beyond.
Ethereum is building a compelling recovery after retesting its long-term trendline. A sharp bounce from the $1,550 area has brought renewed focus to ETH’s macro setup, with price currently hovering near $2,488 and climbing.
Ethereum Regains Structure, Signals Return of Momentum
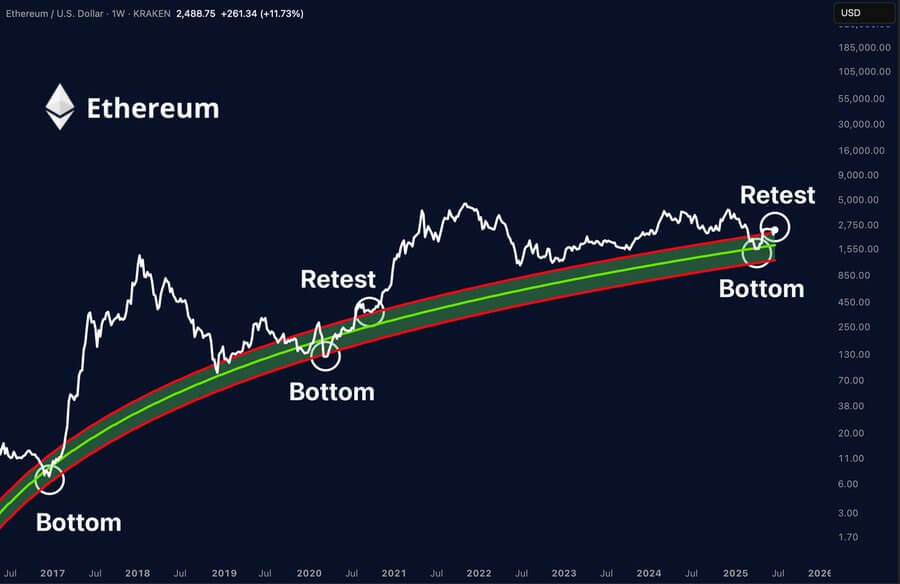
Ethereum is once again interacting with its decade-long logarithmic regression curve. After testing the lower green band support earlier this year, ETH has bounced back with a strong weekly candle. This rebound aligns with previous market bottoms that preceded major upside cycles.
Analyzing Ethereum’s technical position, the multi-year curved trend shape remains a reliable pillar. The $850 to $2,750 green support zone has registered three significant market lows-lastly in late 2018, secondly in mid-2022, and thirdly in early 2025. All three were the endpoint for long-lasting downtrends and prompted robust reversals. Ethereum’s 11.73% weekly gain further suggests that this region still experiences serious accumulation and long-term buying demand.
Source: (X)
Ethereum previously broke out from this curve in 2020 and again defended it in 2022. This time, after rebounding from just under $1,550, Ethereum is now regaining traction above $2,400. Historically, this type of retest often precedes substantial rallies. The green curve continues to hold as the key structural base, while the red upper band, near $3,500 to $4,80,0, now acts as the ceiling. Price action is floating just above the curve’s midpoint, mirroring prior mid-cycle zones that preceded parabolic expansion.
Short-Term Volatility Meets Momentum Shift
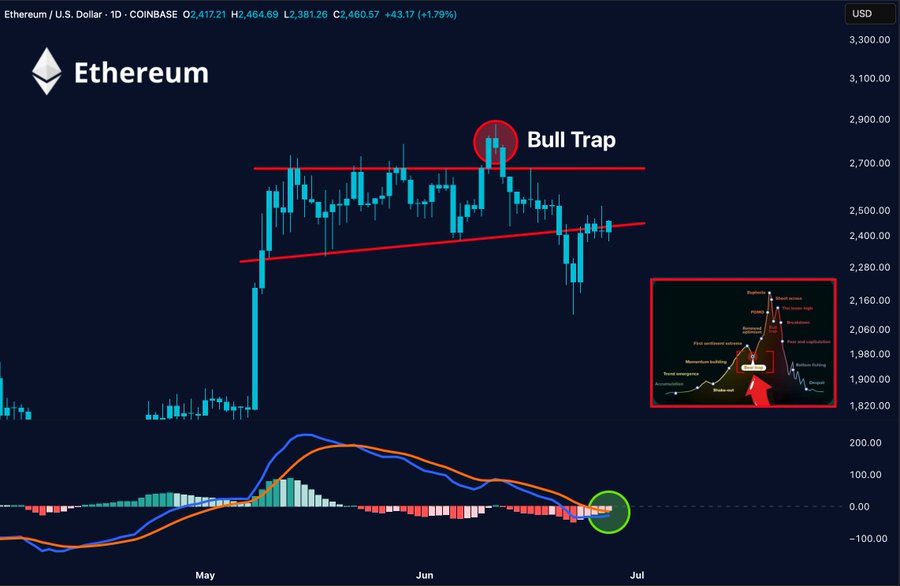
Ethereum’s recent wedge breakdown was followed by a swift recovery from oversold levels. The rejection near $2,870 has since evolved into a cautious rebound above $2,460, as indicators turn.
Ethereum’s MACD now shows early signs of bullish crossover. The blue MACD line is curling upward, moving closer to the orange signal line. Histogram bars are flattening out after a deep bearish phase. Momentum is shifting, and this occurs right as Ethereum attempts to reclaim the $2,500 level. The psychological cycle chart also places Ethereum near the ‘bull trap’ zone, where price typically rejects before a deep flush and reset.
Source: (X)
This behavior matches previous emotional waves. Ethereum flushed out weak hands near $2,260 before finding support and absorbing selling. Now, the question is whether ETH can break past $2,700 and resume trend continuation. A confirmed push above $2,500 could solidify control, though resistance remains sticky.
Ethereum is showing classic compression followed by release-a structure that historically leads to decisive moves. While risks remain, the bounce and improving momentum reflect a cryptocurrency once again aligning with its long-term trend.