
- Ethereum bounces from $2,855 to $3,217 while RSI forms bullish divergence, pointing to weakening downside momentum.
- OBV rises from 19.6M to 23.6M since September, indicating consistent Ethereum buildup despite a 13-month price drop.
- Ethereum is trading significantly above $3,200 and is aiming for $2,716 resistance, showing strong demand at $2,130 levels and rising breakout strength.
Ethereum is showing early indications of a potential reversal as it reclaims the $3,200 region with significant momentum. Technical setup, volume orientation, and momentum indicators are all now in agreement following a long multi-month downtrend.
Ethereum’s Market Structure Forms a Reversal Setup
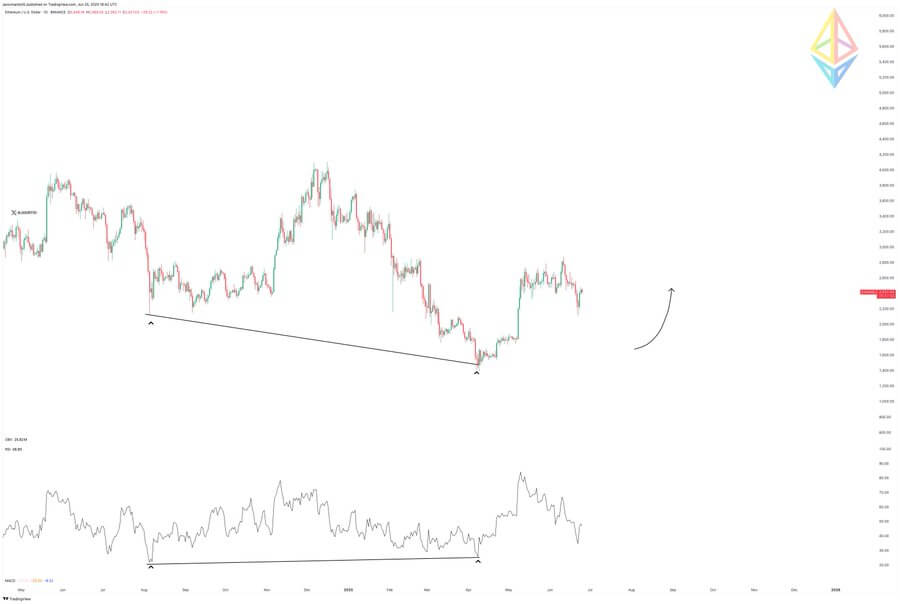
Between April 2024 and May 2025, Ethereum’s price fell from $4,097 to its low of $2,855, which represented a clear downtrend. Recent action, however, has Ethereum rising to $3,217 after it had reached the $2,855 mark, showing short-term bottoming formation. This turnaround creates support below $3,500 resistance as accumulation measures and volume flows begin to reassert short-term attitude.
Source: (X)
Assessing Ethereum’s trend, price created a lower low while RSI printed a higher low from September 2024 to May 2025. This clear divergence shows weakening bearish momentum even as Ethereum dropped further into new swing lows. The Relative Strength Index has turned upward, revealing that buyers are regaining footing inside the descending channel.
On-Balance Volume (OBV) has steadily risen from 19.6 million to 23.6 million since late September 2024, even during price decline. The rising OBV against falling Ethereum price points to continued accumulation and limited seller strength across the recent downtrend. The technical bounce at $2,855 now finds support above $3,200, anchoring near the volume cluster.
Short-Term Levels Anchor Ethereum’s Recovery Path
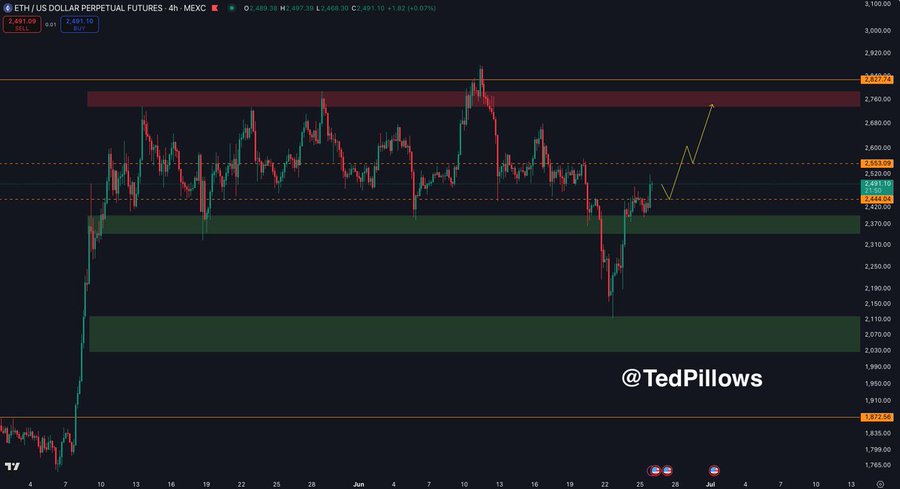
Ethereum rebounded strongly from a $2,062.50 low, surging to $2,491.10 after testing the green demand block between $2,075 and $2,130. Price quickly reclaimed the $2,244 and $2,491 resistance levels, which previously limited upside movement during the June decline. Ethereum is now challenging the mid-range level near $2,553.10—last rejected on June 16.

Source: (X)
Volume wicks around $2,685 show Ethereum faced frequent rejection from sellers near the upper supply band. The breakout attempt from the lower liquidity sweep has now shifted focus toward a retest of the $2,716.70 ceiling. This red resistance band has capped Ethereum’s upside for nearly three weeks, showing strong historical seller activity.
Ethereum’s range remains intact, sitting between $2,716.70 resistance and the lower demand zone near $2,130.00. Holding above $2,491.10 could confirm buyer control and trigger another test of range highs. This structural setup will remain in focus as Ethereum consolidates with OBV rising and RSI momentum improving.
Ethereum trades with a clear divergence structure, consistent OBV inflows, and higher demand zone reactions, adding fuel to its recovery narrative.