
- Ethereum is nearing an important support zone, with the momentum indicators hitting oversold levels after months of heavy selling pressure.
- Ethereum is nearing an important support zone, with the momentum indicators hitting oversold levels after months of heavy selling pressure.
- RSI values of around 30 indicate that momentum may be shifting to the downside around price levels.
Ethereum Rebound Outlook is in focus as ETH is near critical support levels, with technical indicators pointing to fading downside momentum, while traders are considering a near-term bounce.
Ethereum Tests Major Support After Extended Weakness
Ethereum has spent months moving within a persistent downward trend. Lower highs and lower lows have defined market structure. Selling pressure repeatedly limited recovery attempts throughout the correction.
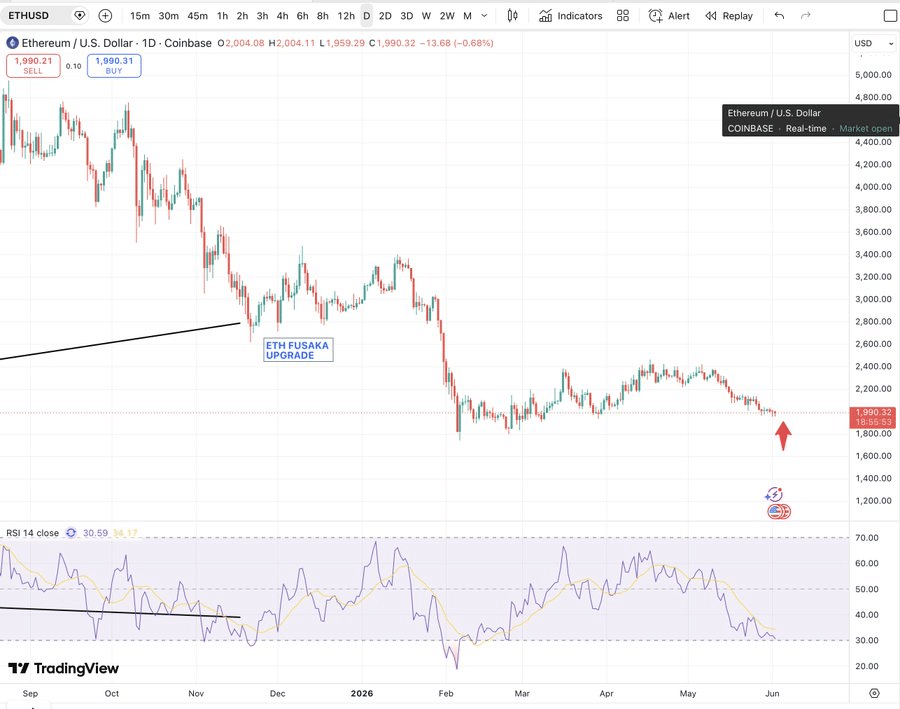
The chart as of writing places ETH near the $1,850-$1,950 region. This area has attracted buyers several times previously. Market participants continue monitoring this zone closely.

Unlike earlier pullbacks, momentum conditions have changed noticeably. The recent decline arrived with indicators already nearing oversold territory. That distinction has increased attention on potential stabilization.
Price action also reflects a market searching for direction. Buyers remain active near support levels. Sellers, however, still control the broader trend structure.
Market Watches Oversold Conditions for Recovery Signals
A recent post on X from veteran trader Matthew Dixon outlined a constructive near-term outlook. The tweet suggested Ethereum may be approaching favorable support conditions. Dixon noted growing short-term bullishness following a broader crypto wash-out.
The Relative Strength Index remains central to this assessment. RSI readings are hovering near the traditional oversold threshold. Such levels often appear when selling momentum begins fading.

Oversold conditions alone do not guarantee a rebound. However, they frequently coincide with improving risk-reward setups. Traders often watch these periods for signs of buyer reentry.
The chart’s projected path points toward a near-term recovery. An upward arrow indicates expected short-term strength. This scenario would fit historical countertrend rallies during corrective phases.
Long-Term Cycle Debate Remains Unresolved
Despite near-term optimism, broader cycle concerns remain present. Dixon’s analysis points toward a possible final low later this year. October was identified as a potential timeframe for that event.
Ethereum’s behavior since February adds context to this view. Following a sharp decline, price entered an extended consolidation phase. Volatility moderated compared with earlier selling periods.
Sideways trading often reflects balance between buyers and sellers. It can also signal a transition within a larger market cycle. Participants continue evaluating whether accumulation is underway.
The longer-term outlook remains tied to future cycle development. According to the analysis, another decline could precede recovery. After that process, Ethereum could establish foundations for a move toward new all-time highs.
At present, Ethereum trades near $1,970 while testing important support. Short-term momentum conditions have improved relative to previous declines. The market now faces a critical period as traders assess whether support can generate a meaningful rebound before the broader cycle reaches its eventual low.