
- Ethereum’s cycle mirrors Bitcoin’s previous breakout suggesting a breaking of resistance, that may be an explosive rise.
- Tightening price action indicates an impending breakout, while a symmetrical triangular formation indicates market indecision.
- Analyst forecast a spike toward $6K–$7K if Ethereum breaks resistance, which would be consistent with past market patterns.
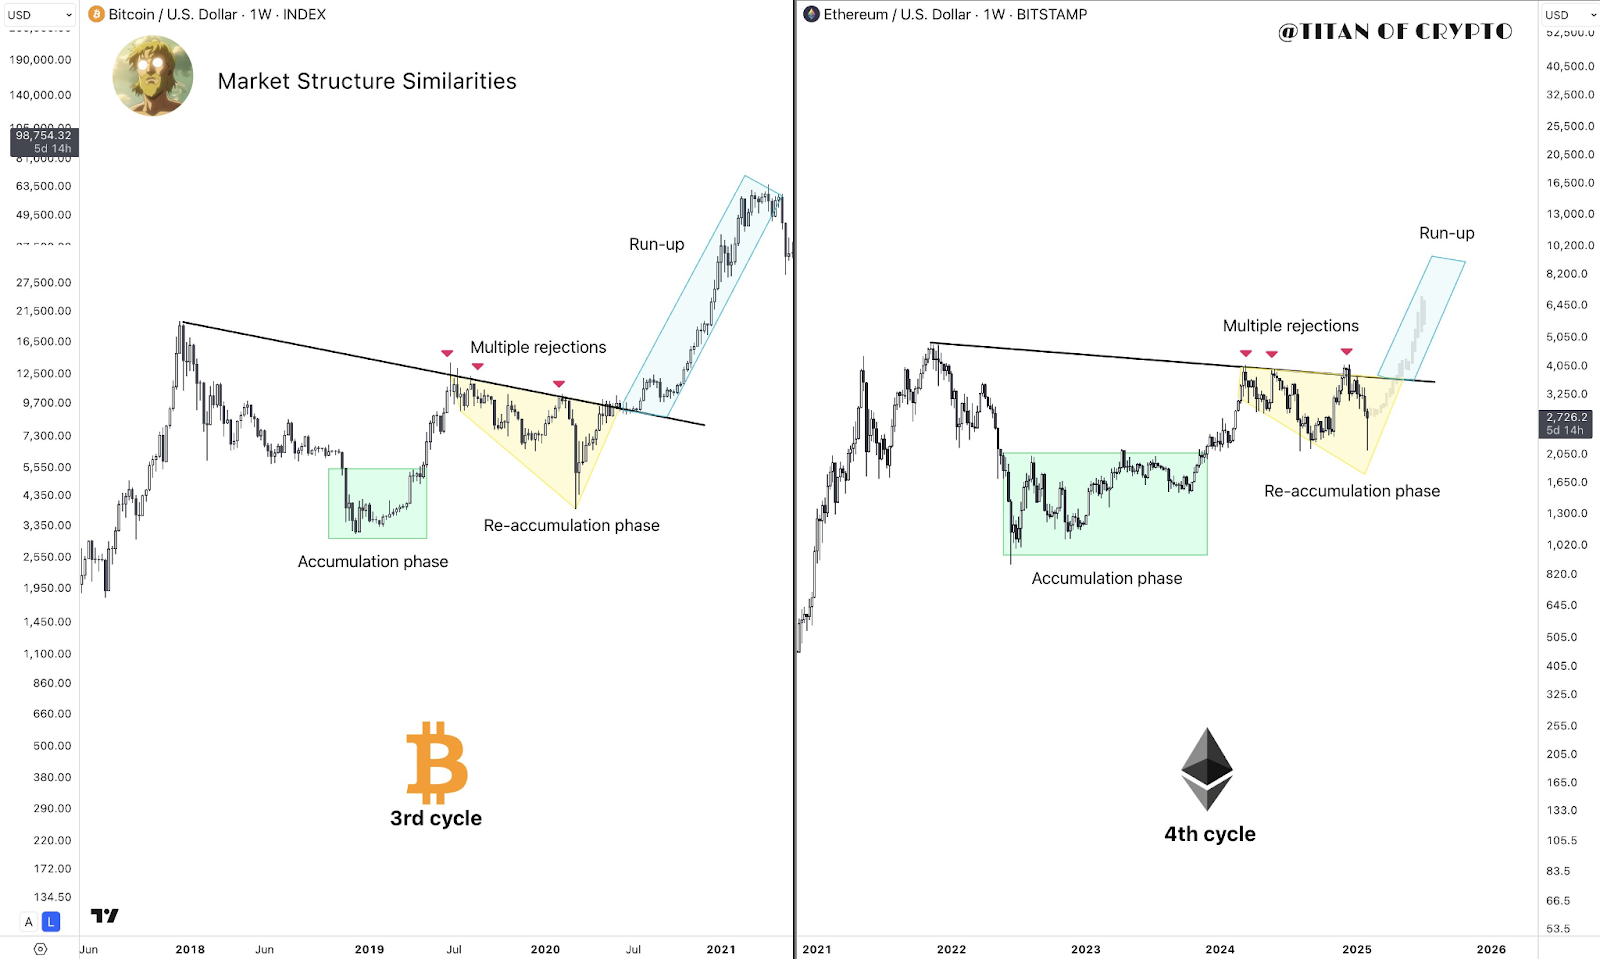
According to Analyst Titan of Crypto, Ethereum is displaying signs of a breakout, which resembles past market cycles exhibited by Bitcoin. Given that the current stage of Ethereum matches the third cycle of Bitcoin before its breakout, these cycles point to an imminent rise. Ethereum appears to be poised for a major upswing based on the current market trend.
Ethereum’s Cycle Resembles Bitcoin’s Past Surge
Titan of Crypto notes that Ethereum’s fourth cycle mirrors Bitcoin’s third cycle before its breakout. Both cycles feature accumulation, re-accumulation, and breakout phases. In Ethereum’s case, the accumulation phase showcased sideways movement, reflecting strong investor confidence.
Following this, the re-accumulation phase emerged. Here, Ethereum faced multiple rejections from a descending trendline. However, increasing buying pressure hinted at an upcoming trend reversal. Bitcoin followed the same pattern before its price surged. Consequently, Ethereum might experience a similar explosive move if it breaks through resistance.
Symmetrical Triangle Indicates a Critical Zone
Ethereum’s price action against Tether (USDT) on Binance presents a symmetrical triangle formation. This pattern consists of higher lows and lower highs, indicating market indecision. However, tightening price ranges often lead to strong breakouts. Ethereum previously saw a major uptrend before entering this consolidation phase.
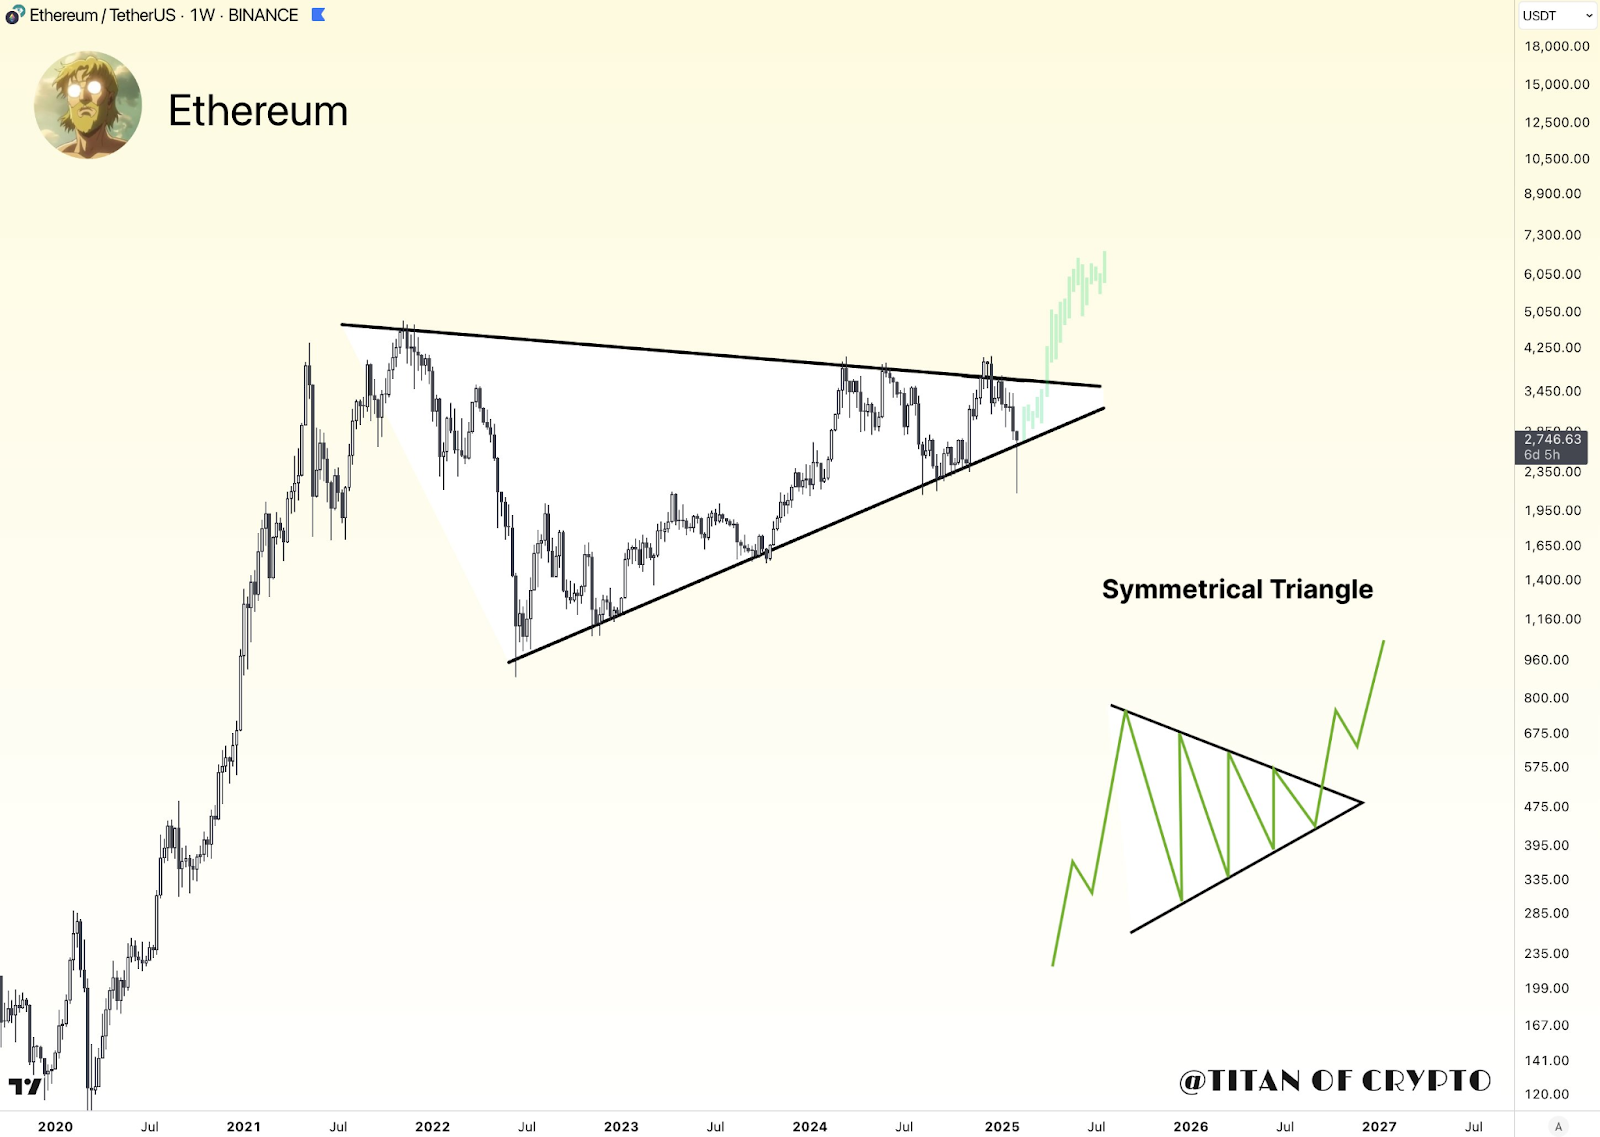
The resistance trendline has prevented breakout attempts. However, the support trendline has held strong, showing persistent demand. With Ethereum approaching the upper resistance, analysts suggest a breakout is imminent. If Ethereum surpasses this resistance, a bullish continuation could follow.
Potential Price Targets and Market Implications
Ethereum is currently trading near $2,746. A decisive breakout could push prices toward the $6,000 to $7,000 range. Market history supports this projection, as symmetrical triangles often lead to sharp price movements. Increased volume during a breakout will confirm the trend.
If Ethereum fails to break resistance, it may retrace toward support before another attempt. Nevertheless, historical trends suggest Ethereum is positioned for a strong run-up. Given Bitcoin’s past performance, Ethereum could experience a similar price explosion.