
- Ethereum nears breakout as it completes a rare descending broadening wedge on the weekly chart.
- On-chain data shows lower ETH selling pressure and rising ETF inflows signal growing investor interest.
- Key resistance lies at $4,000, with breakout targets ranging between $4,568.90 and $6,000.
Ethereum (ETH) is approaching a key technical pattern on the weekly chart that has previously preceded strong upward price moves. The cryptocurrency is currently trading at $3,656 after rebounding from a brief decline. A rare descending broadening wedge is about to complete, suggesting a possible breakout ahead.

Descending Broadening Wedge Signals Potential Breakout
According to analysis prepared by Titan of Crypto, Ethereum has formed a descending broadening wedge on the weekly chart. This chart pattern is defined by diverging trendlines, which expand as price oscillates within a broadening range. Historical chart data shows that this structure is often found at the end of a downtrend or long consolidation.
Ethereum has maintained higher lows over several weeks while gradually approaching resistance near $4,000. The pattern’s structure appears well-formed, with multiple wave-like movements inside the formation. According to Ibrahim_Trade786, a breakout above this resistance could trigger a move toward $6,000, as the setup reflects a period of structured accumulation.
At present, Ethereum’s RSI on the weekly chart remains near neutral, and momentum indicators have started to stabilize. This positioning suggests that ETH is neither overbought nor oversold, and buying pressure could resume as volume increases.
Support from Market Data and Onchain Metrics
According to an observation by CryptoQuant, Ethereum is experiencing lower selling pressure than Bitcoin. The ETH/BTC exchange inflows ratio has dropped to a five-year low, indicating fewer coins are being moved to exchanges. This trend reduces the risk of sudden selloffs.
In addition, Ethereum spot ETFs recorded $332.2 million in inflows on Wednesday, showing renewed interest from institutional investors. Data from Glassnode shows that major support lies between $2,000 and $3,000, while $4,500 remains a major resistance level.
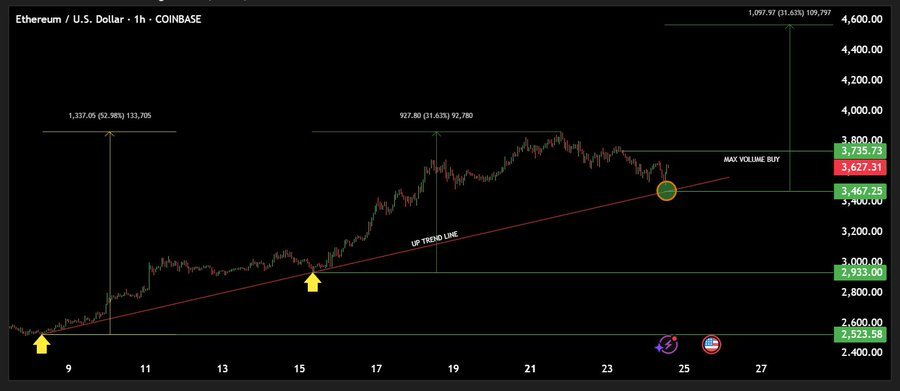
Lau, a market analyst, noted that Ethereum gained over 52% in 15 days and is now retesting a long-term trendline. If this trendline holds, ETH could move towards $4,568.90. However, a failure to break it might result in short-term downside before further recovery.