
- Ethereum clings to $2,430 support after three key tests, but weakening rebounds suggest bulls are losing short-term momentum.
- Volume increases on breakdowns below $2,390 indicate increased selling pressure as the price approaches a critical acceleration zone at $2,315.
- A declining structure and lower highs keep Ethereum susceptible, with downside risk increasing below the $2,430-$2,315 range.
Ethereum price action enters a pivotal zone as structural pressure builds beneath key horizontal support. Technical patterns signal a shift, raising short-term risk for a bearish breakdown for the Cryptocurrency.
Traders Watch $2,430: Hold or Collapse?
Ethereum trades just above its long-standing $2,430 support, a level tested three times since May. Despite recent rebounds, consistent lower highs suggest fading momentum. Current chart behavior reflects a tightening structure with elevated downside risk.
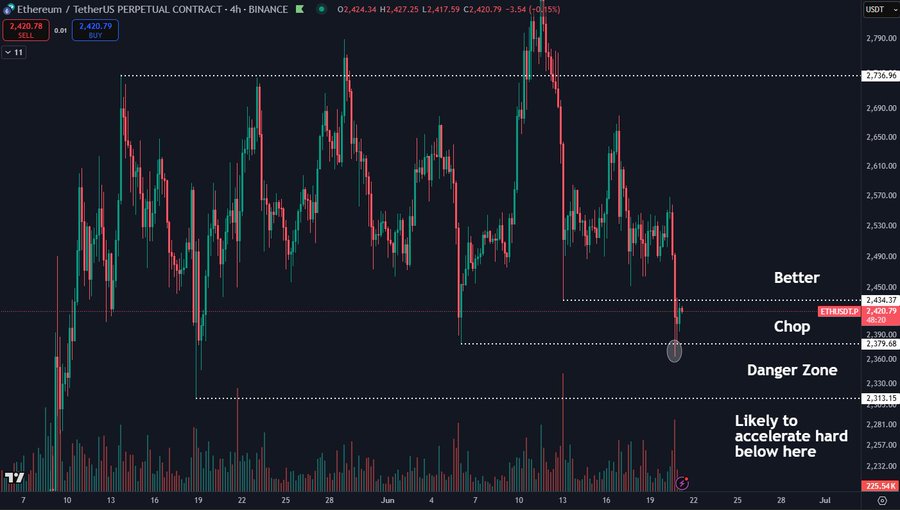
As price navigates below $2,450, Ethereum struggles to regain mid-range control following a sharp drop from $2,550. The 4-hour chart now exposes key vulnerabilities across the $2,315–$2,430 corridor. Ethereum’s failure to maintain former support at $2,390 reinforces short-term bearish momentum and casts doubt on upside recovery.
Source: (X)
Horizontal structure from the $2,796 peak down to the current zone defines a descending rhythm. Ethereum printed lower highs across each rally rejection, emphasizing seller strength. Price now floats in a transitional zone where liquidity remains thin, further amplifying volatility risk. Ethereum needs a firm recovery above $2,430 to shift the short-term structure toward neutral. Until then, downward bias remains valid with an open inefficiency below $2,315.
Candlestick behavior shows increased volume on each breakdown attempt. Ethereum pierced below the $2,390 mark with a notable spike in sell-side activity, pushing price into the chart’s “Danger Zone.” That volume expansion confirms institutional attention at these breakdown levels. Ethereum must now defend $2,315 decisively to avoid cascading liquidation events.
Bullish Defense or Bearish Trap?
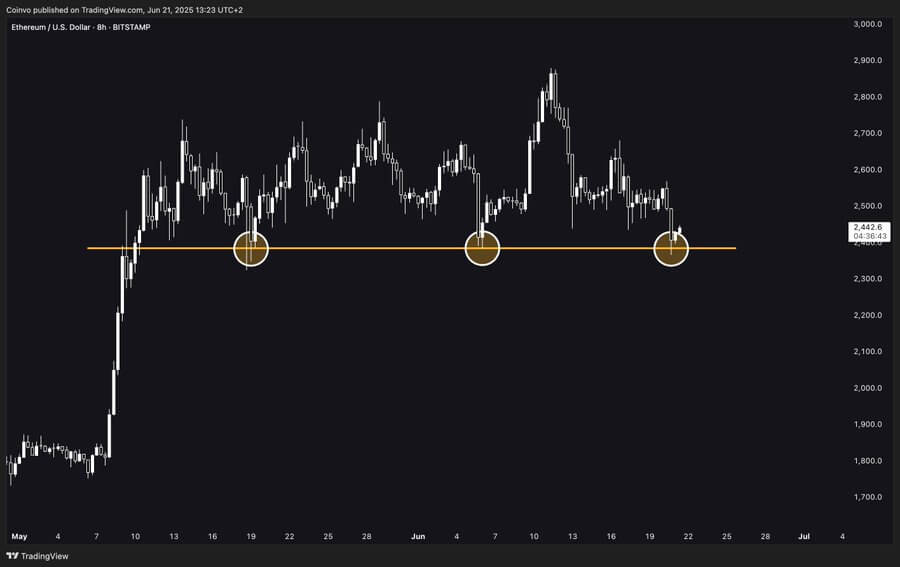
Ethereum has tested the $2,430 support three times since May, revealing consistent demand pressure. This triple interaction signals psychological weight. Yet each rebound grows weaker, reflecting declining buyer conviction.
Ethereum again tapped the $2,430 support on June 21, with price rebounding to $2,442.6. Rejection wicks at this level confirm short-term buyer activity. Still, the broader range between $2,430 and $2,900 now looks compressed by descending highs and tightening volatility bands. Ethereum’s recent intraday dip below $2,430 warns of weakening structural integrity.
Source: (X)
Volume profile shows consistent order flow around this horizontal base, but with diminishing strength on each bounce. Historical behavior suggests that the more a level is tested, the higher the probability it eventually breaks. Ethereum currently trades just above this threshold, teetering on the edge of a structural shift. Will bulls defend this level for a fourth time-or will bears force a break and reclaim control?
Ethereum’s setup remains technically bearish while within this descending formation. Ethereum now balances between a short-term rebound and potential acceleration lower. Ethereum must reclaim $2,450 to delay deeper downside toward $2,200. All eyes stay fixed on the $2,315–$2,430 region as Ethereum’s next move will likely define the upcoming trend.