
- Ethereum has replicated a pattern that led to a 165% surge, with a target set at $4,723.5 and potential beyond $8,100.
- Key support and resistance levels for Ethereum are $1,900 and $3,200, with a possible breakout signaling a major rally.
- RSI and moving averages suggest Ethereum may soon reverse its downtrend, potentially targeting $7,000 in the coming weeks.
Ethereum has replicated a trend that previously led to a 165% surge. JavonTM1 has pointed out that the target sits at $4,723.5, and a breakout could push the price beyond $8,100. This suggests Ethereum could experience a near 2X increase, signaling the possibility of another major rally in the coming weeks.
Key Support and Resistance Levels Define Market Direction
Ethereum has been following a descending channel for some time. The price has fluctuated between $1,900 and $3,200, with clear zones where the market experienced consolidation or sharp reversals.
These points have created notable support and resistance levels. Resistance remains firm around $3,200, while support is evident near $1,900. The market’s current movement suggests a potential end to the downtrend, with Ethereum poised for a breakout.
The term “GO TIME” has been used to signal a potential bullish reversal, indicating Ethereum might soon overcome the persistent resistance levels. If Ethereum manages to break through the $3,200 resistance, it could initiate a rally toward the projected target of $7,000. However, any failure at this point may result in further consolidation or a retest of lower levels.
RSI Points to Potential Reversal
A key element to watch is the RSI, which has been signaling oversold conditions. This divergence between price and momentum is aligned, reinforcing the idea of an upcoming upward movement.

The RSI also highlights moments when Ethereum’s price reversed, suggesting the market may be due for a bounce. With momentum potentially shifting, Ethereum might soon move into a more bullish phase.
Moving Averages and Recent Price Trends
The moving averages provide further insights. The MA50 and MA200 lines are key indicators of Ethereum’s short- and long-term trends. Notably, the price struggled after falling below these averages in August.
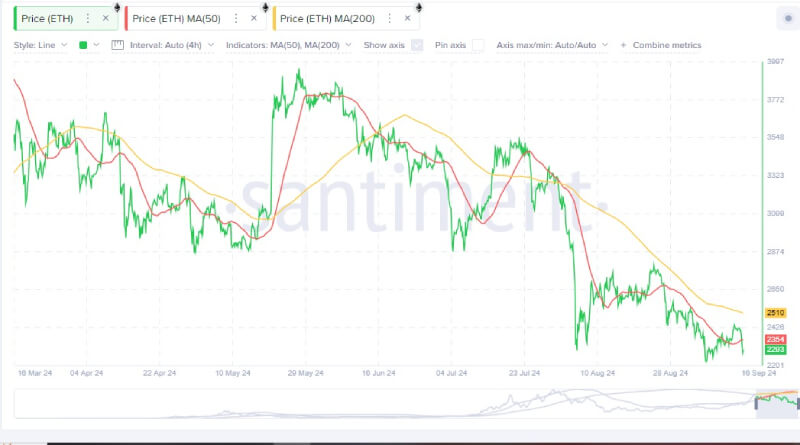
The recent death cross, which occurred when the MA50 crossed below the MA200, indicates bearish pressure. Ethereum currently sits at $2,293, with resistance holding around the MA50 at $2,354.