
- Ethereum could drop to $3,300 if it fails to break $3,800, as technical indicators warn of a potential short-term correction.
- Analysts see Ethereum mirroring Bitcoin’s 2020 breakout, with consolidation hinting at a major rally past $4,000.
- MACD signals and a confirmed bear trap below $1,600 suggest Ethereum may rally toward $9,000 if bulls break key resistance.
Ethereum resides at the critical $3,700 range. Following a 50% recovery from the $2,400 level, the asset is currently up against opposition in the $3,800–$4,000 range. Although short-term technicals point to a potential decline, more general market trends suggest a huge breakout. At $3,673.72, Ethereum has experienced a slight daily decline of 1.07%.

Bearish Divergence or Bullish Breakout?
Crypto analyst Michaël van de Poppe notes a bearish divergence following Ethereum’s $1,200 surge. He highlights a lower high, which raises concerns. If ETH fails to break above $3,800, he warns of a possible drop toward $3,400. This aligns with liquidity patterns, suggesting many long positions could be liquidated.
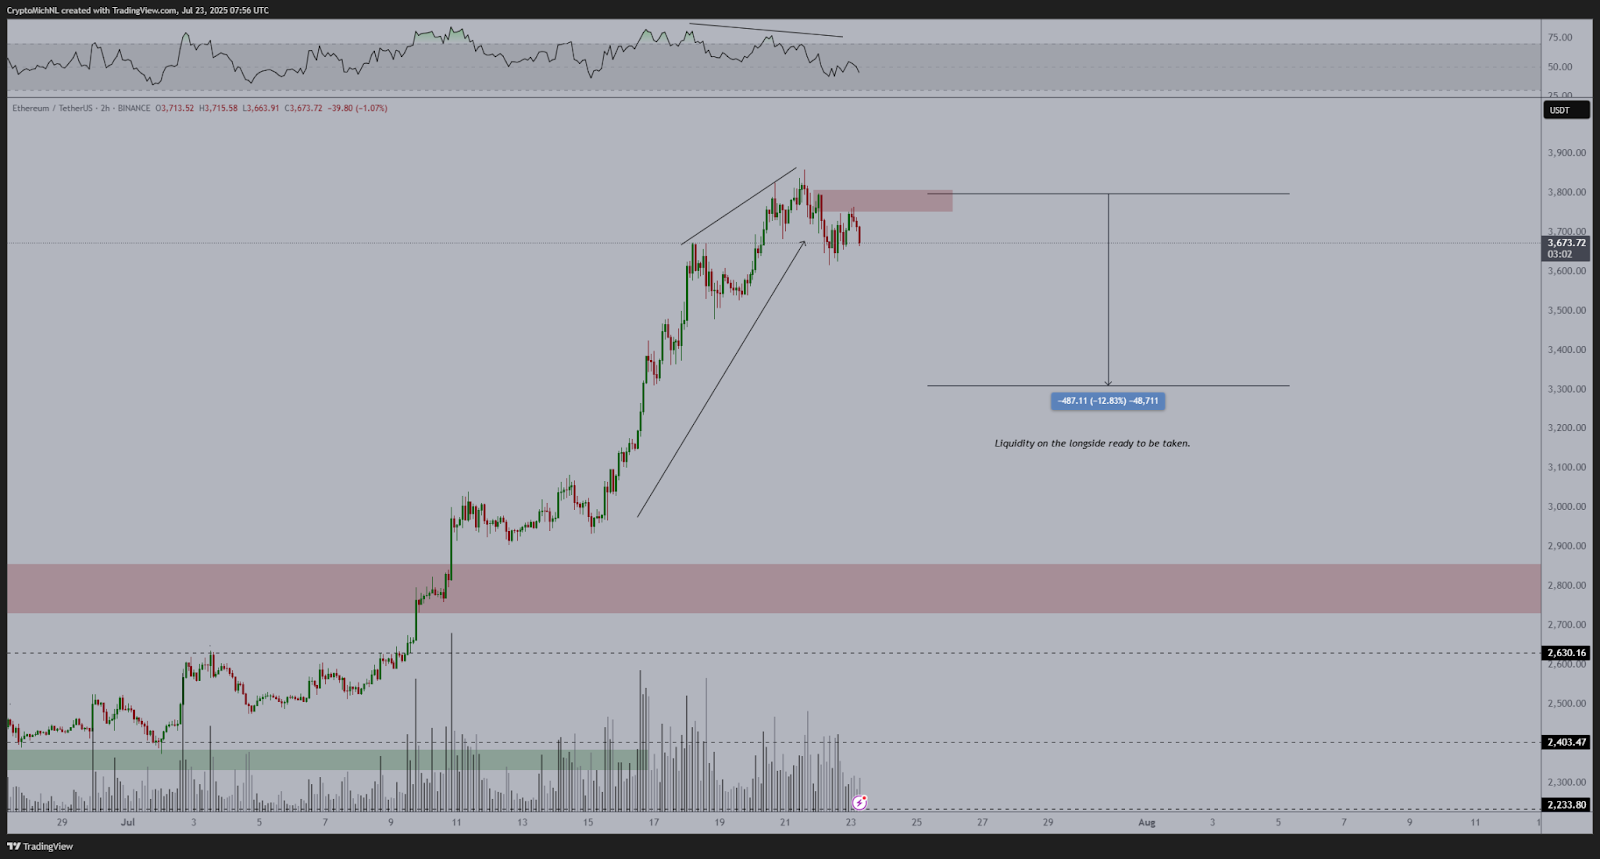
Source: Michael van de Poppe
The TradingView chart shows clear support at $2,630.16. A decline toward the $3,300 level remains possible, especially if the uptrend channel breaks. Besides, volume has dropped, which often signals hesitation. Momentum indicators like RSI also reflect indecision, hovering around neutral levels.
Fractal Patterns and MACD Signals Spark Hope
On the flip side, Bitcoinsensus compares Ethereum’s current chart to Bitcoin’s 2020 cycle. Back then, BTC saw multiple failed breakouts before a mega rally.
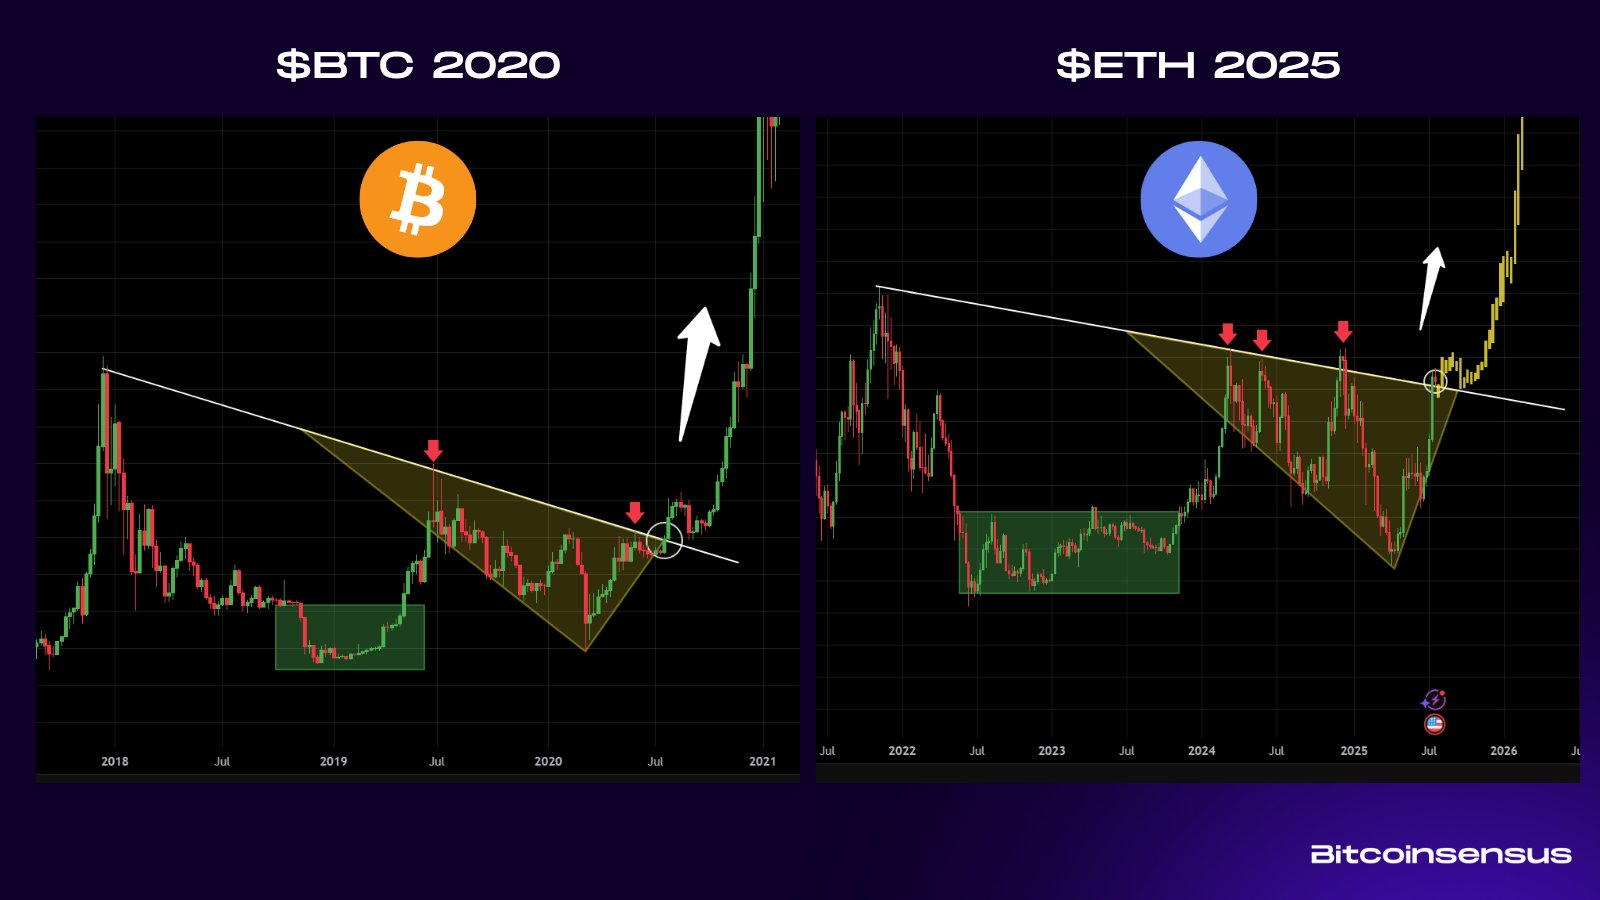
Source: Bitcoinsensus
ETH is now tracing a nearly identical pattern. False breakdowns, triangle formations, and heavy consolidation all mirror BTC’s historic run.
Moreover, Merlijn The Trader offers another bullish thesis. He sees Ethereum repeating its 2023 breakout play. His chart reveals a MACD bullish crossover and a confirmed bear trap below $1,600. This signal points to renewed momentum. If ETH closes above $4,000, Merlijn expects a move toward $9,000.
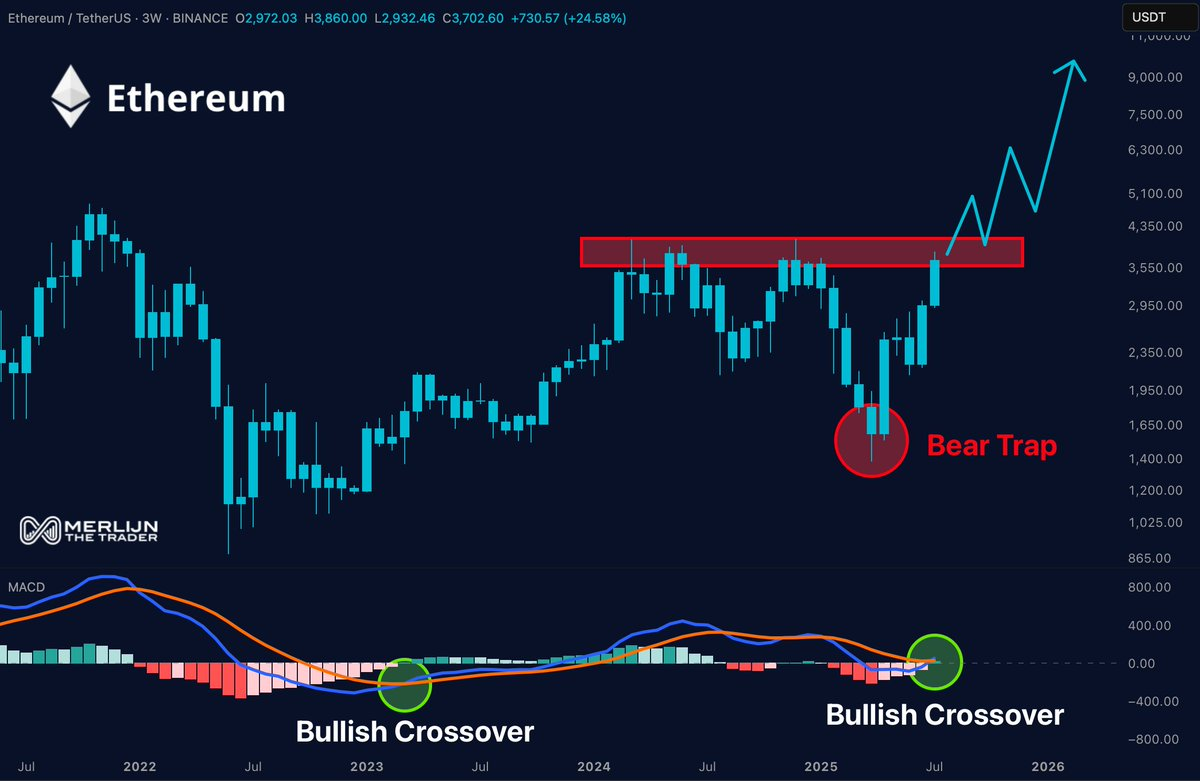
Source: Merlijn The Trader
Ethereum now stands at a pivotal moment. Bulls must push past the $4,000 resistance to trigger the next phase of the rally. If rejected, the price could tumble toward $3,300. However, strong technical indicators and pattern repetition support the bullish case.