
- ETH forms a triple top pattern, indicating weakening bullish momentum since March 2024.
- Critical support trendline tested multiple times is at risk of breaking, signaling potential sharp declines.
- Ethereum Spot ETFs report a $795 million outflow, reflecting falling institutional confidence amid price volatility.
Ethereum faces growing bearish pressure as a triple top pattern emerges on the 3-day chart. Coupled with significant ETF outflows, ETH’s price hovers near $3,995, signaling potential for a sharper decline amid recent weekly losses of over 10%.
Triple Top Pattern Signals Weakening Momentum
Ethereum’s price has been forming a clear triple top pattern on the 3-day chart against USDT. From March 2024 through July 2025,each peak has been slightly lower than the previous one, showing that buying strength is fading.
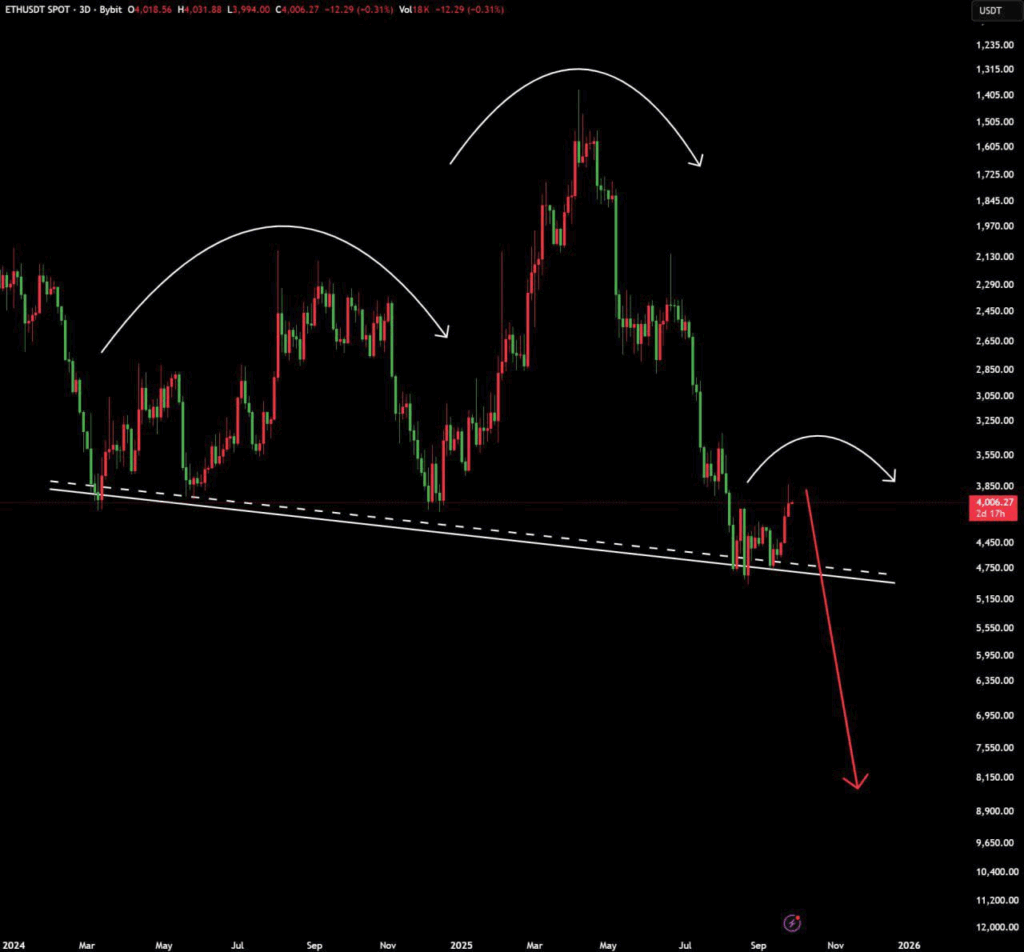
This pattern is a classic signal that the bulls might be losing control. To make matters more concerning, the support line acting as the pattern’s neckline has been tested multiple times since early 2024.
Currently, ETH is hovering just below this key support, and if it breaks decisively, we could see a sharp drop to $2,500 or lower, following historical precedents.
Institutional Outflows Signal Growing Caution
Institutional activity adds another layer to this developing bearish story. According to data from SoSoValue, Ethereum Spot ETFs experienced a massive outflow of $795.56 million in the week ending September 26, 2025. This marks one of the most significant capital withdrawals in recent months.
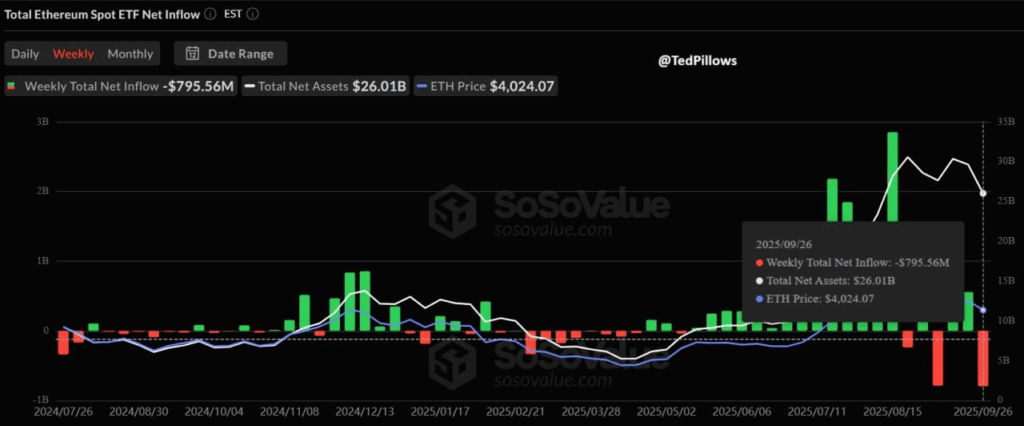
Despite ETH’s price sitting above $4,000, this sharp pullback in inflows suggests institutional investors are losing confidence or repositioning amid the increased volatility. Total ETF net assets have dropped to $26.01 billion from highs over $30 billion earlier this year, confirming a shift in sentiment.
Earlier in the summer, inflows had surged alongside bullish price moves. Now, the reversal and spike in outflows align with the technical breakdown, pointing to a cautious outlook among larger market players.
Support Zones Will Determine Short-Term Direction
Ethereum is trading above the $3,850 and $3,900 support zone. In the past this area has been a strong buying point that has helped maintain bullish momentum.
If ETH fails to hold this support,it may floor to around $3,600.If ETH bounces from support, it could retest resistance near $4,060, with tougher levels ahead at $4,265 and $4,752.Traders should watch trading volume and whether prices close below support to gauge the next move.