
- Ethereum breaks above $2,800 with a big green candle, repeating a 2024 setup that previously triggered a 42% rally toward $4,000.
- ETH’s strong weekly breakout above major resistance signals bullish momentum and could push prices to $4,200 in the coming weeks.
- With volume rising and market sentiment turning positive, Ethereum may follow its 2024 path and surge past $4,000 if it holds above $3K.
Ethereum has printed a major bullish breakout on the weekly chart, reviving hopes of a strong short-term rally. The price has surged above a crucial resistance zone near $2,800. This move resembles the February 2024 breakout that led to a 42% gain. If history repeats itself, ETH could hit $4,200 within a few weeks.
This week’s price action stands out. Ethereum closed a large green candle, breaking above both June’s highs and a key horizontal level. This specific zone acted as resistance in the past. Moreover, this is the first time since early 2024 that ETH has shown such momentum on the weekly timeframe.
Pattern Repeats From 2024
In February 2024, ETH broke above the same resistance level. The breakout triggered a sharp 42% surge. The price moved from around $2,800 to nearly $4,000 in just a few weeks. The setup looks almost identical now. Back then, a big green candle confirmed the breakout, followed by sustained gains.
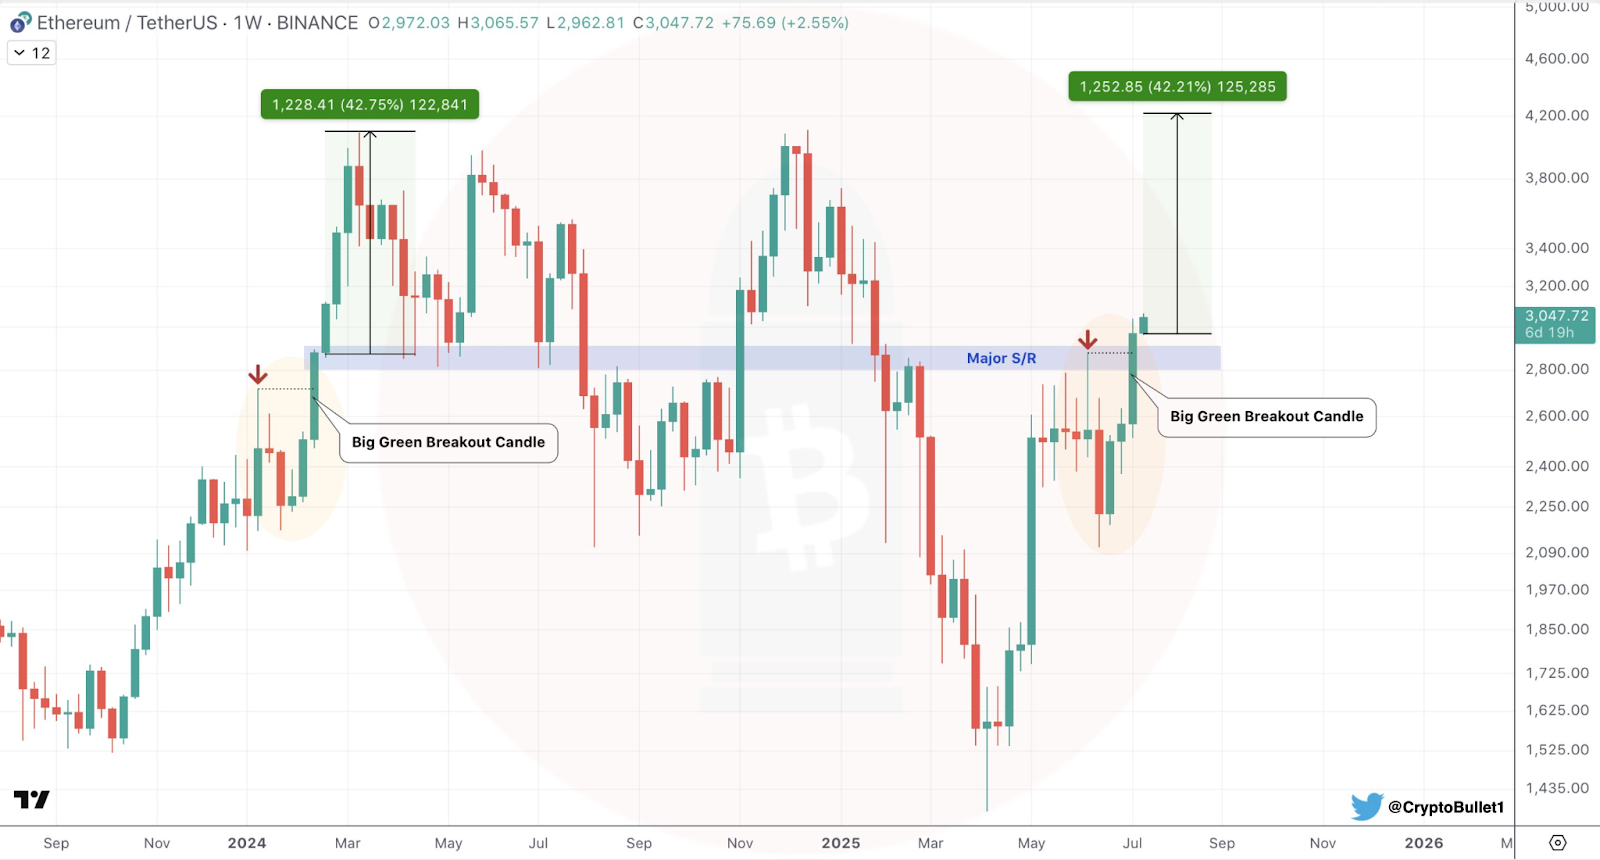
Source: CryptoBullet
Now in July 2025, the weekly chart has printed another big green candle. The breakout pattern and structure match those seen in 2024. Hence, traders believe this move could bring similar upside. If Ethereum mirrors that past rally, the price could reach the $4,200 mark in three to four weeks.

Technical Outlook and Market Sentiment
Besides the breakout candle, ETH’s momentum indicators show strong bullish signals. Volume is picking up, and market sentiment has turned positive. More traders now expect Ethereum to retest its all-time highs. However, the $3,000 level remains a key zone to watch. ETH must hold above it to keep the bullish setup valid.
Additionally, there maybe be short-term pullbacks. Breakouts often face minor corrections before continuing upward. But as long as ETH stays above the breakout zone, bulls remain in control. Ethereum’s weekly chart signals a powerful breakout. The pattern mirrors a proven 42% rally from 2024. if momentum holds, ETH may hit $4,200 very soon.