
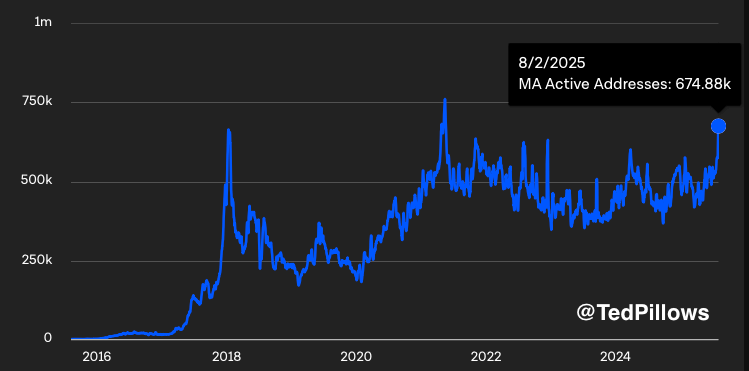
- Ethereum active addresses hit 674,880 on Aug 2, nearing 2021 highs, suggesting strong, sustained network engagement.
- Exchange outflows over $100M suggest long term holding behavior as ETH stabilizes near $3,550 after sharp pullback.
- ETH price fell from $4,000 to $3,100 but recovered above $3,500, aligning with renewed network activity and reduced selling.
Ethereum’s network activity has sharply increased, with the number of active addresses rising to 674,880 as of August 2, 2025. This is one of the highest levels recorded since the 2021 cycle peak near 750,000.

According to analyst TedPillows, Ethereum is now approaching engagement levels not seen since that period. This uptick in active addresses shows consistent growth over the past year, suggesting increased usage across the network.
Notably, similar increases in past cycles aligned with major price runs, including those in late 2017 and early 2021.
Rising User Activity Shows Organic Network Growth
The moving average of active addresses from 2016 to 2025 shows a steady rise through 2024 into 2025. On August 2, it reached 674,880, just below the record highs. This rise stands out, especially as it coincides with Ethereum’s recent price recovery.
Unlike previous speculative peaks, the current trend is more organic, with user activity growing steadily over time. In past cycles, spikes in address activity often aligned with periods of increased investor interest.
This includes the late 2017 surge and Ethereum’s breakout during early 2021. Now, the consistent rise through mid 2025 resembles those patterns, although the growth appears more sustained than sudden.
Negative Netflows Dominate and Exchange Withdrawals
Between July 18 and August 3, negative netflows dominated Ethereum exchange data. During this period, more ETH exited exchanges than entered. Withdrawals reached over $100 million during late July, particularly around local price highs.
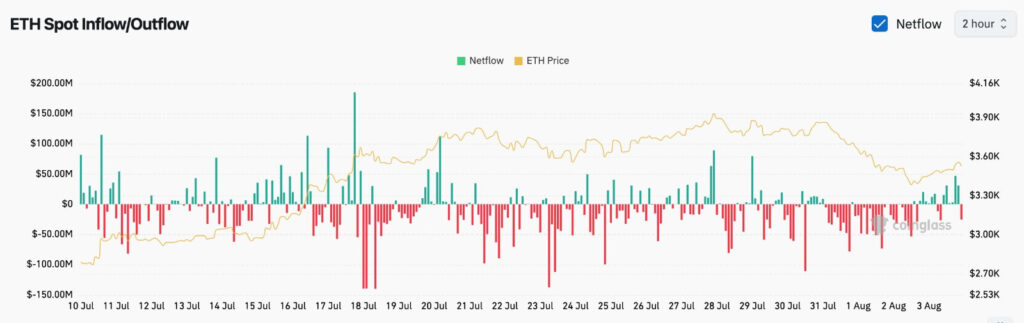
This suggests that some investors opted for long term storage instead of keeping assets on exchanges. Around August 3, inflows briefly rose, pointing to possible short term profit taking.
This change came after Ethereum dropped sharply from a high near $4,000 to around $3,100. However, the trend quickly reversed, with outflows returning as price stabilized near $3,550 by August 4.
Ethereum Price Sees Pullback Then Stabilizes Above Key Level
Ethereum’s price began the period near $2,700 and climbed to nearly $4,000 by July 28. A swift pullback followed, pushing the price down to about $3,100 by August 2. As of August 4, Ethereum recovered some ground and traded in the $3,550–$3,600 range.
This price action coincides with key exchange flows. While inflows rose during the decline, they did not persist. Instead, outflows returned as price rebounded, supporting the pattern of holding over selling. The $3,500 mark has emerged as a psychological level during this fluctuation.