
- Ethena ($ENA) is nearing a breakout above the $0.4600 resistance, which could trigger a bullish surge toward $0.6800.
- The price is consolidating within a descending wedge, with repeated tests of the upper trendline indicating potential breakout strength.
- A failed breakout could lead to a pullback toward the $0.3200 support, extending consolidation within the wedge pattern.
According to analyst Ali, Ethena is coming to a make-or-break stage, trading in a falling wedge on the 4-hour chart in the form of a right angle. The cryptocurrency has been consolidating near the important $0.4600 resistance zone. A confirmed breakout from the region can pave the way for a run-up to the $0.6800. ENA/USDT is trading at $0.4554, lower by a small 1.21%.
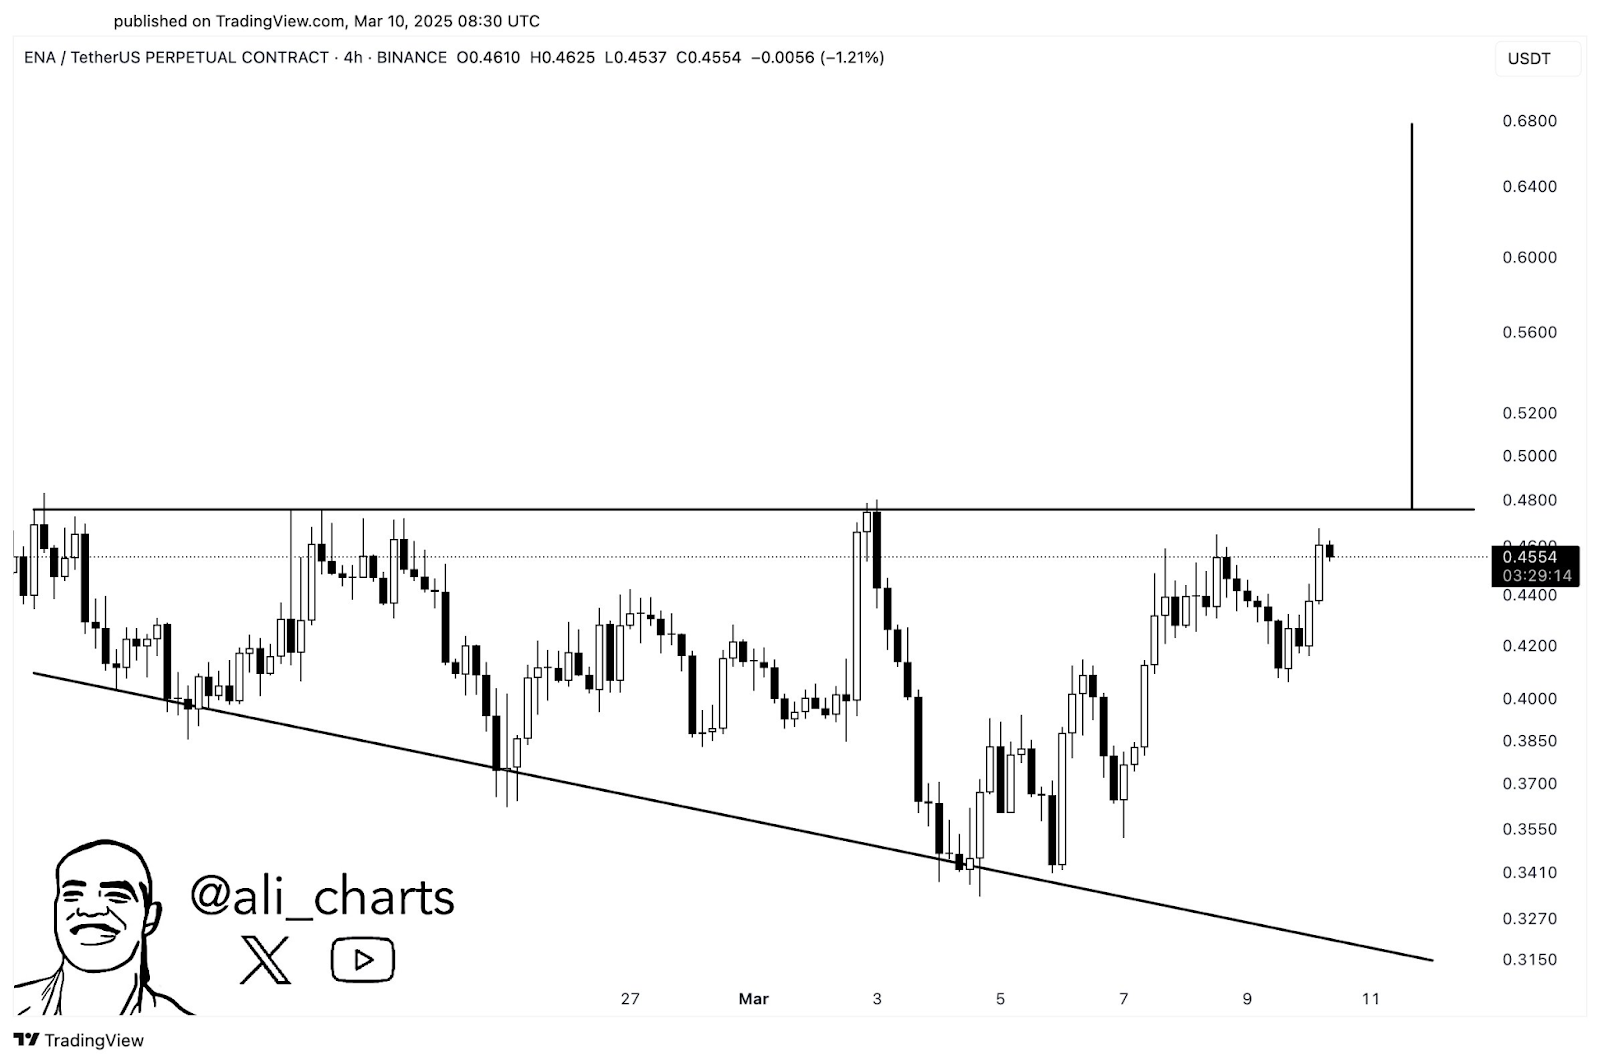
In the recent trading sessions, the price has been moving within the wedge pattern with lower highs and lower lows. The upper trendline has always been acting as a resistance, and the lower trendline has been acting as a good support. The price has always tested the upper boundary, facing selling pressure and returning on a temporary basis.
Resistance Test and Breakout Potential
The $0.4600 resistance level has proven to be a barrier. It has been tested multiple times, highlighting strong market tension. Despite the downward trajectory, occasional bullish momentum has emerged, pushing the price closer to the resistance. Recently, ENA exhibited an upward move, signaling potential strength for a breakout.
Moreover, if ENA closes convincingly above the $0.4600 resistance, it could trigger an extended rally. The projected breakout target is set near $0.6800, based on the wedge’s chart projection. This scenario would confirm bullish momentum and encourage further upward movement. However, volume data is absent, making it essential to observe price action closely for confirmation.
Risk of Rejection and Support Levels
Conversely, failure to surpass the $0.4600 resistance may prompt a pullback toward the wedge’s lower trendline. This crucial support lies near the $0.3200 level. Rejection at resistance could extend consolidation within the descending wedge, prolonging market uncertainty. Notably, recent candlestick formations show increased volatility. Several long wicks suggest fluctuations and indecision among traders.