
- ETH holds above $3,500–$3,600 support, confirming a bullish breakout with a target of $12,300 based on a 4-year triangle pattern.
- OBV trend is upward, indicating strong accumulation and supporting continued ETH price growth despite short term pullbacks.
- ETH maintains bullish flag and falling wedge patterns, with $4,000 as the next key target and $3,750 as a conservative profit zone.
Ethereum continues to show strength despite recent pullbacks, with analysts pointing to technical confirmations supporting further upside. On the daily chart, the asset recently rebounded from the $3,600 level after reaching a local high near $3,747.
Price has held above key support at $3,500–$3,600, where analysts view the ongoing pattern as a healthy consolidation. This comes as Ethereum maintains a bullish formation, with several confirmation points pointing toward a potential continuation.
Despite short term hesitation, Ethereum’s chart presents a larger bullish pattern forming over multiple years, now showing signs of a confirmed breakout.
Falling Wedge and Flag Continuation Keep ETH in Bullish Levels
Ethereum first showed signs of recovery after breaking out of a downtrend in late March. This initial reversal was the beginning of a falling wedge breakout, with price confirming bullish continuation around $2,500.
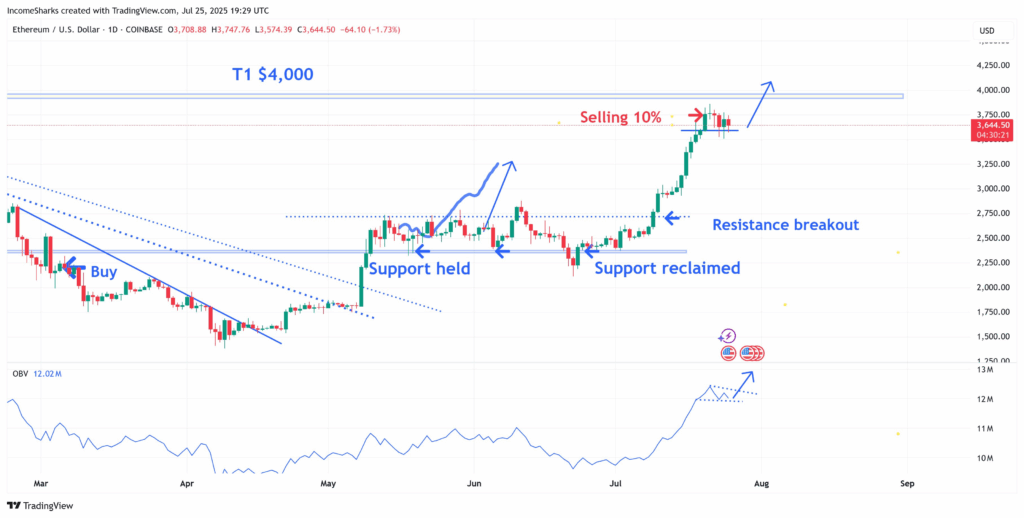
As Ethereum advanced, the $2,800 support zone held throughout May, providing additional confirmation of momentum strength. However, in early July, price briefly dipped toward $2,250 but quickly reclaimed the level.
Analysts interpreted this recovery as a renewed bullish signal, supporting the uptrend. Notably, price later rallied past $3,700 before pulling back to $3,644. This retreat has not yet invalidated the pattern, with volume remaining supportive.
Ethereum’s target is near the $4,000 mark. A partial take profit zone is slightly below, near $3,750, which aligns with previous resistance zones. This conservative sell target suggests cautious optimism among traders.
OBV and Volume Structure
The On Balance Volume (OBV) indicator shows an uptrend, indicating consistent accumulation even during pullbacks. According to the latest dotted OBV projection, the indicator remains in a breakout mode, which supports the idea of continued price growth.
While price action consolidates, the OBV’s upward moves support the strength. Volume behavior is key here, especially as analysts watch for sharp increases during breakout attempts. Until a major divergence occurs, the volume trend supports a bullish continuation scenario.
The current market structure remains intact, as price holds above the $3,500–$3,600 zone. A drop below could risk testing lower supports near $3,250, although this level has not yet come into play.
ETH Breaks Out of 4 Year Triangle With Eyes on $12K Target
According to Captain Faibik, Ethereum has broken out of a four year symmetrical triangle. This macro formation connected Ethereum’s all-time high at $4,800 to a series of lower highs and rising lows. The structure converged into mid 2025 and now shows a confirmed breakout.
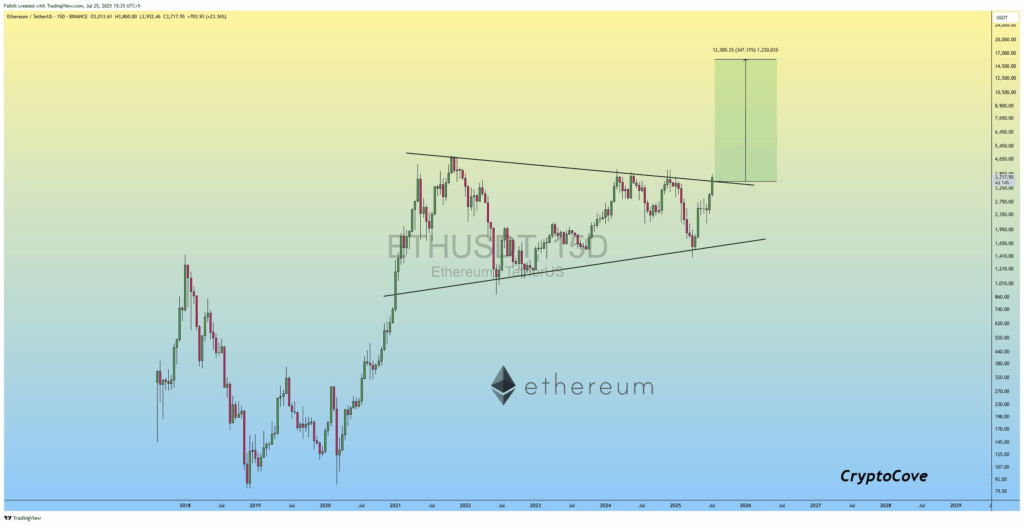
The analyst projects the breakout target at $12,300.15, derived from the height of the triangle structure added to the breakout level near $3,540. This method follows classical charting techniques for triangle breakouts.
For this breakout to maintain momentum, Ethereum must continue trading above the $3,500–$3,600 level. Analysts generally look for increased buying interest to validate larger structural moves.
Bull Flag Structure, Support, and $12K Targets
Ethereum is structurally bullish, with falling wedge confirmation, strong OBV readings, and a macro breakout aligning across timeframes. Price is holding key support at $3,500–$3,600, which may lead to further moves toward $4,000.
The breakout from the four year triangle suggests larger upside potential toward $12,300 if the structure holds. Volume trends support accumulation, and short term pullbacks remain within expected consolidation zones.