
- ENA climbed from $0.083 to $0.166 as dollar-based open interest surged from $113 million to $237 million.
- Coin-denominated open interest rose 23%, showing much of the dollar increase came from ENA’s sharp price appreciation.
- ENA’s RSI reached 79.42 as 0.1600-0.1657 became resistance, while $0.1400 remains the nearest support.
ENA has gained nearly 70% since August 17 as dollar-based open interest more than doubled. According to Santiment Intelligence, open interest rose from $113 million on August 18 to $237 million. However, coin-denominated open interest increased only 23%, showing much of the dollar growth came from higher ENA prices.
ENA Trading Activity Expands
Santiment reported that ENA climbed from roughly $0.083 on August 17 to about $0.141. The token later reached $0.1657 on the four-hour chart before pulling back. Daily active addresses also increased to 1,946, about 2.5 times the August baseline.
Santiment said this was the highest level recorded during the period. Meanwhile, coin-denominated open interest rose from approximately 1.36 billion ENA to 1.68 billion. The increase compares with the much larger move in dollar-based open interest.
Santiment described dollar leverage as explosive, while coin-based leverage remained ordinary. The difference reflects the impact of ENA’s price increase on existing positions. Separately, the Ethena team withdrew $23.6 million worth of ENA from exchanges today. The transaction occurred during the token’s sharp price advance.
ENA Chart Shows Strong Bullish Momentum
The ENA four-hour chart shows a move from the 0.08-0.09 region toward $0.1537. The latest candle opened at $0.1558 and reached $0.1657. It later fell to $0.1364 before closing at $0.1537, representing a 1.28% decline. Trading volume reached about 290.96 million ENA during the move.
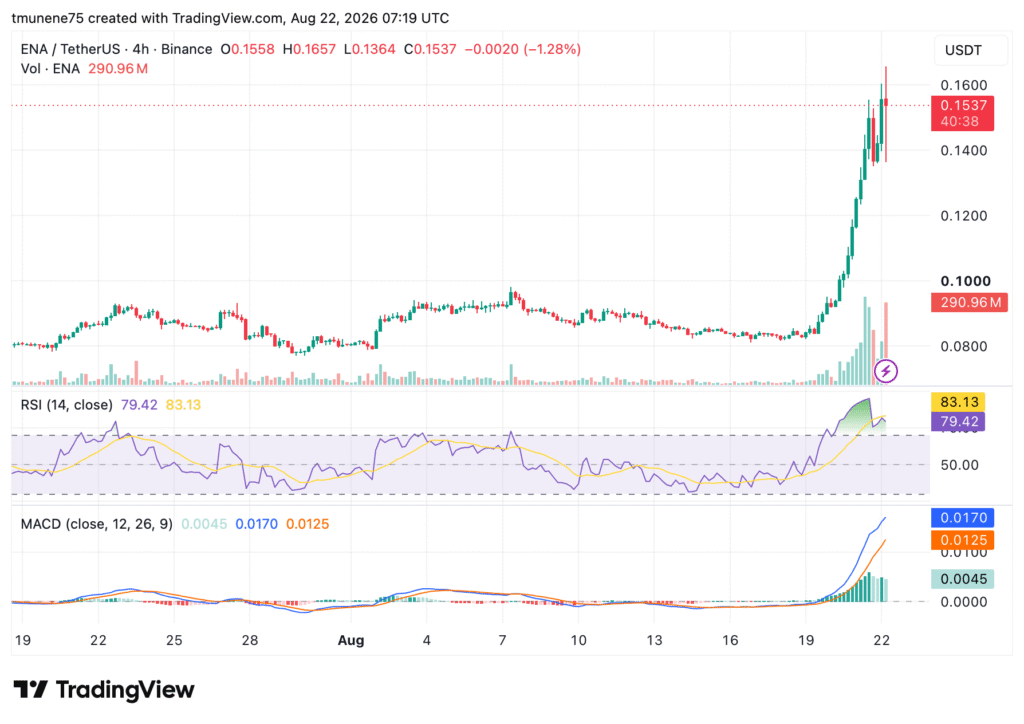
However, momentum indicators remain elevated. The RSI is at 79.42, while its moving average was around 83.13. The MACD also remained positive, with the MACD line at 0.0170. The signal line is at 0.0125, while the histogram reached 0.0045.
ENA Faces Resistance After Fast Rise
The 0.1600-0.1657 area represents the immediate resistance zone on the supplied chart. ENA’s recent high reached $0.1657 before the latest pullback. Meanwhile, $0.1400 serves as near-term support. The next support levels sit around $0.1200 and $0.1000.
The elevated RSI places ENA above the conventional 70 overbought level. The chart data therefore shows strong momentum alongside elevated volatility.