- EDU price analysis shows a 20% rally reaching upper channel resistance after base formation.
- Short-term strength appears rotation-driven as EDU outperforms most USDT pairs.
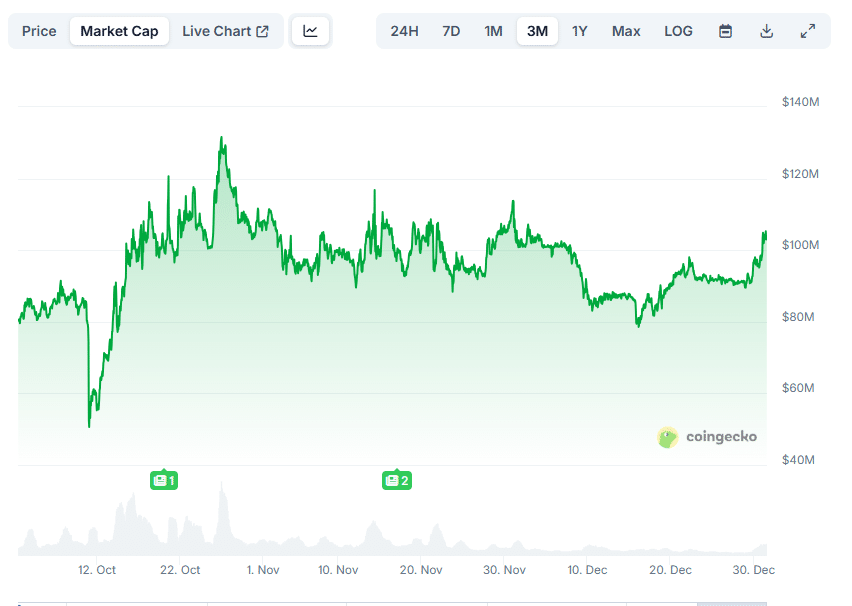
- Market cap trends reflect consolidation following October’s speculative expansion.
EDU price analysis places the asset at a technically sensitive point as price tests channel resistance. Recent gains reflect selective participation, while broader market conditions remain balanced and cautious.
Descending Channel Frames the Broader Trend
EDU price analysis on the 12-hour timeframe shows price moving within a clearly defined descending channel. This structure has guided price since the late-October peak, marking a sustained corrective phase.
Each rally within the channel has produced a lower high, while pullbacks formed lower lows. This behavior confirms that the broader trend has remained under pressure despite intermittent recovery attempts.
Recently, EDU rebounded from the channel’s lower boundary near the 0.13–0.14 USDT zone. This bounce created a short-term base, allowing buyers to push price upward with renewed momentum.
Resistance Test Signals a Critical Decision Zone
EDU price analysis identifies the current price area as structurally important. The projected upside of roughly 21% aligns with the upper channel resistance near 0.16–0.17 USDT.
This zone also overlaps with prior horizontal resistance, increasing the likelihood of a meaningful reaction. Price behavior here will help define whether the corrective structure remains intact.
A rejection would likely return price toward mid-channel levels or established support. Sustained strength above resistance, however, would suggest exhaustion of selling pressure and growing trend reversal risk.
Relative Strength and Market Cap Consolidation
EDU price analysis is reinforced by short-term market data shared by World Of Charts on social media. A Binance spot snapshot shows EDUUSDT leading gains, rising over 4.7% during the observed period.
This outperformance is notable given the broader market’s neutral posture. With bullish sentiment near balance and average price change minimal, EDU’s strength appears selective rather than market-driven.
Market capitalization trends support this view. After peaking near $125–130 million in late October, EDU entered a choppy consolidation. A higher low formed near $80–85 million in early December, followed by a measured recovery toward $100 million, signaling stabilization rather than speculative excess.