
- DOT’s breakout from a descending trendline signals bullish momentum, with potential targets at $7.596, $9.195, and $11.649.
- A strong support zone has fueled price rebounds, preventing further declines and reinforcing market confidence.
- Historical patterns suggest past breakouts led to major gains, hinting at a possible sustained uptrend for DOT.
Polkadot (DOT) is showing strong performance, with market conditions hinting at a potential price surge. A slight market shift could push DOT into a critical resistance zone. This observation is based on recent price action and trend analysis.
DOT/USDT Shows Signs of Reversal
The daily chart of DOT/USDT on Binance shows a falling wedge breakout occurred in early November, leading to a price surge. The price rose sharply before hitting a major resistance level, marked by a red arc. This resistance point triggered a trend reversal.
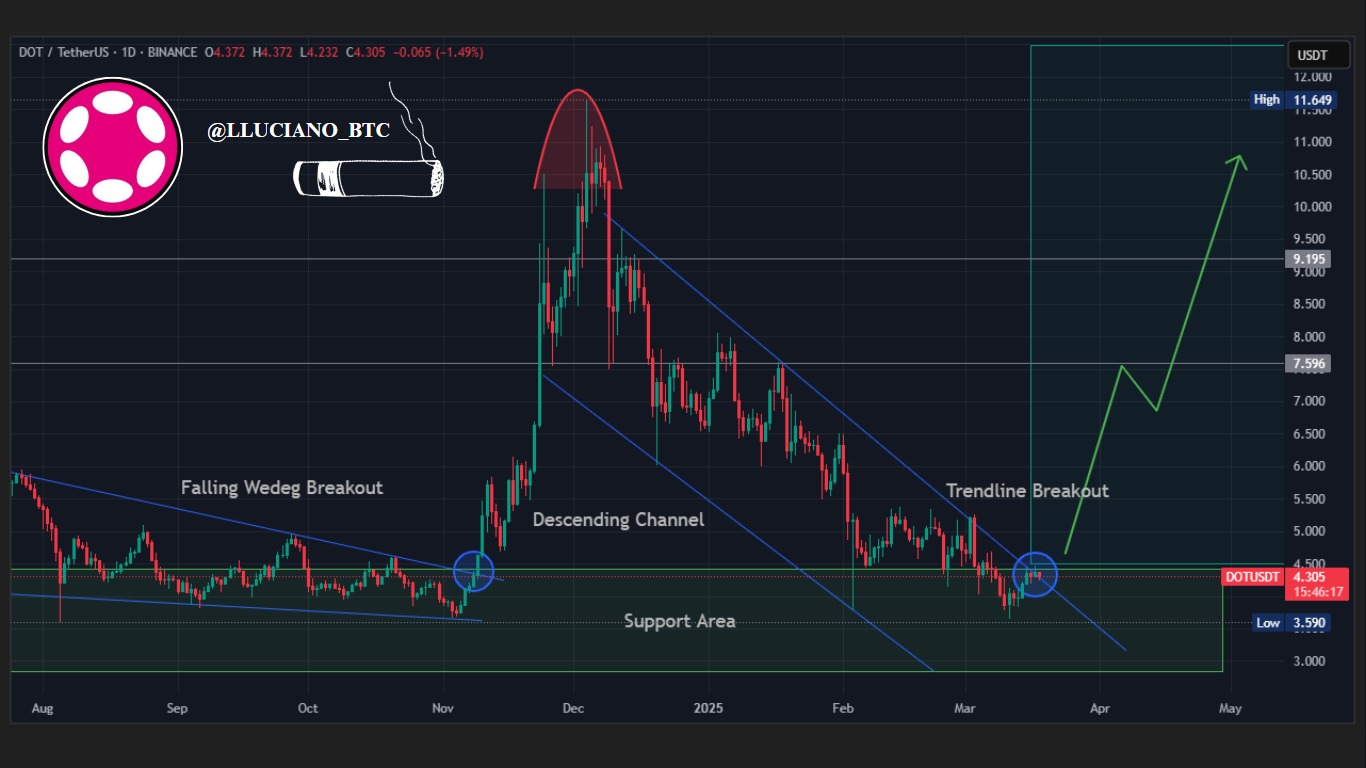
Following the peak, DOT entered a descending channel. The price gradually declined, bouncing between support and resistance levels. The lower boundary of this channel provided stability, while the upper boundary limited upward movement. The market followed this pattern, maintaining a steady downtrend.
Recently, a trendline breakout signaled a potential shift in momentum. A blue circle highlights this breakout point, confirming a break above the descending trendline. This move suggests a growing bullish sentiment, which could lead to further price appreciation.
A critical support zone at the bottom of the chart has provided a strong foundation for price rebounds. Buying pressure has historically increased at this level, preventing further declines. The price recently tested this zone before rebounding.
The projected price movement suggests an upward trajectory. The first target level is around $7.596, where resistance is expected. If DOT breaks this level, the next target is $9.195. A sustained bullish rally could push the price toward $11.649, a major resistance area.
Market Structure and Potential Trends
DOT has moved through multiple market cycles, reflecting both bullish and bearish phases. The presence of a falling wedge breakout, descending channel, and recent trendline breakout suggests a structured price movement. Historical patterns indicate that similar breakouts have led to significant price gains.
Moreover, technical indicators align with the current price action. The breakout from the descending trendline hints at renewed market strength. If buying pressure continues, DOT could experience a substantial uptrend.