
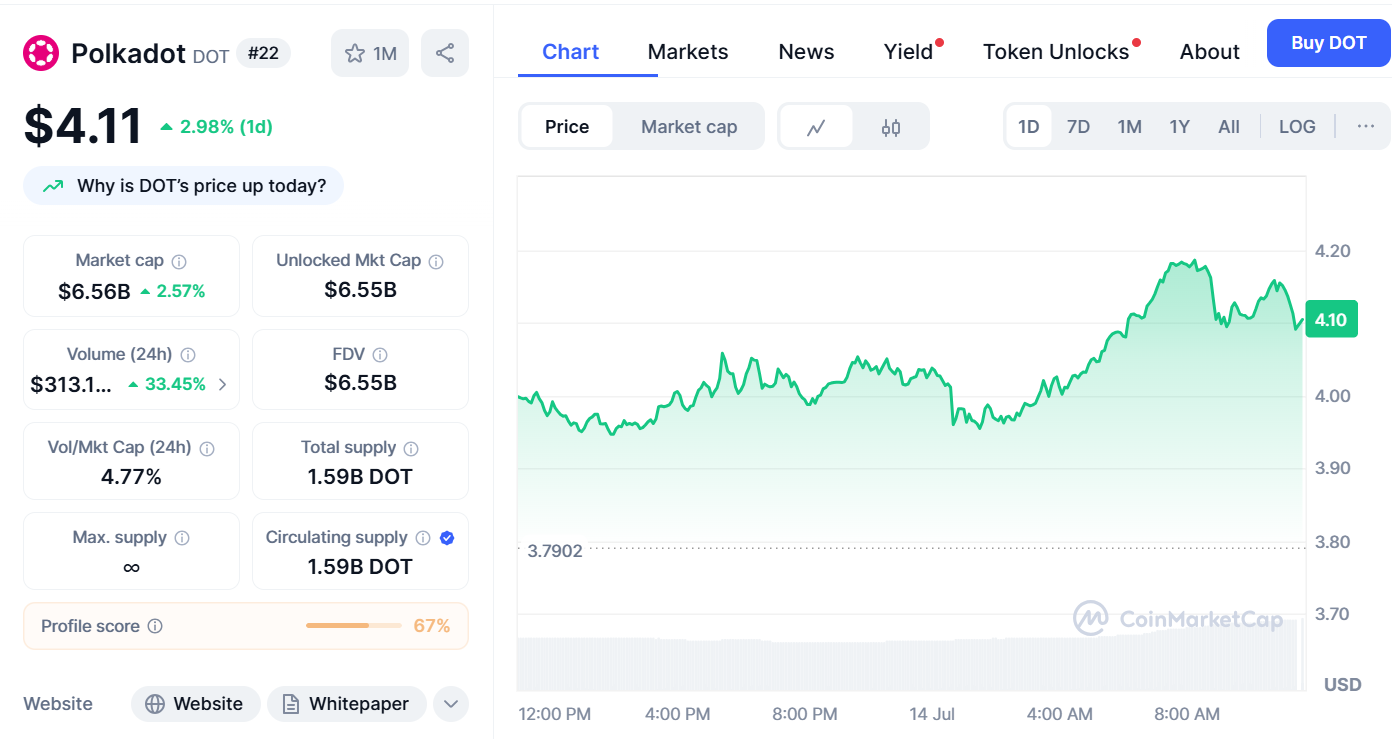
- DOT confirms breakout from falling wedge, with price rising from $3.15 to $4.17 on strong volume.
- Volume jumped 33.45% in 24 hours, supporting a potential move toward the $7.90 projected target.
- Technical upgrades and bullish indicators suggest DOT could extend gains above $5.40 resistance.
Polkadot is showing renewed bullish strength after breaking above a long-term falling wedge pattern, supported by a rise in trading volume and investor activity. After months of sideways action and lower highs, this technical breakout signals a potential trend reversal and opens the door for a substantial upward move.
Breakout Confirms Reversal After Prolonged Downtrend
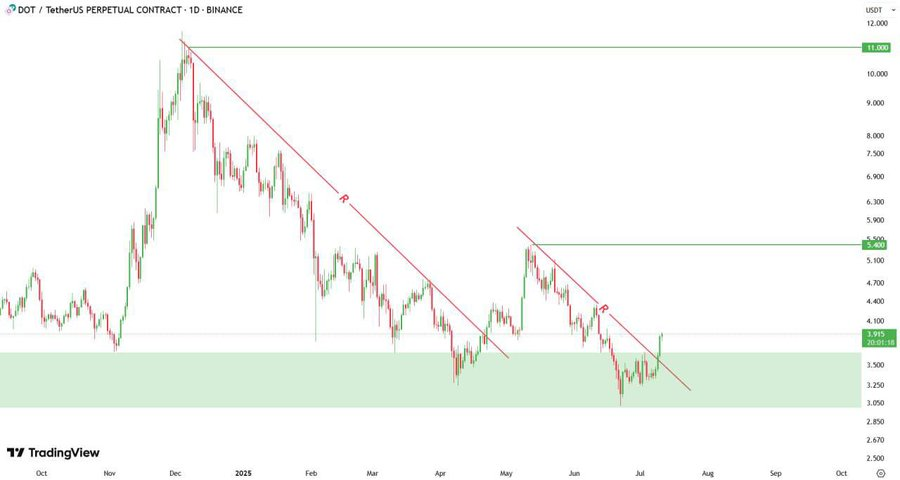
Polkadot has broken above a descending wedge pattern that had been forming since early 2024, According to analysis prepared by Captain Faibik. The price moved from around $3.15 to $4.17, confirming the breakout with strong bullish candles and increased trading activity. The wedge pattern, typically a bullish structure, signals the end of the prior downtrend that started in late 2023.
The breakout was supported by rising volume, which surged by 33.45% in the last 24 hours, reaching $313.1 million. This volume increase helps confirm the breakout’s strength and indicates renewed market interest. DOT’s current market cap stands at $6.56 billion, with full token circulation and a volume-to-market cap ratio of 4.77%, showing strong liquidity levels.
A measured move from the wedge pattern projects a target near $7.90, nearly 96% above the breakout point. This aligns with previous movements where Polkadot posted similar bullish follow-through after pattern completions.
Technical Indicators and Upgrades Support Further Momentum
According to BitMonty, DOT also broke above a short-term descending resistance trendline after bouncing from a key demand zone near $3.90. He noted, “If the price sustains above $3.90, it could target the next major resistance at $5.40.”
The price currently trades near $4.12, supported by bullish indicators such as RSI near 66 and MACD showing continued upward strength. DOT has maintained its position above short-term moving averages, and resistance at $4.20 is being tested again. A move beyond $4.68 could open the way to the longer-term target between $7.90 and $8.00.
Such bullish behavior of DOT relies also on the recent improvements such as Elastic Scaling and JAM protocol that may enhance the accuracy of the network and its scalability. All this, together with an increase in volume, shows that DOT may be in the process of managing a powerful upward wave in the nearest weeks.