

- At 111.95, which corresponds to important Fibonacci retracement levels, the U.S. Dollar Index (DXY) encounters resistance, suggesting a possible reversal.
- With wave (5) aiming for the 100% Fibonacci extension close to 95.64, a five-wave downward trajectory indicates negative momentum.
- According to historical fractal analysis, the dollar has declined by 10% since the inauguration, indicating a potential equilibrium between 90 and 95 points.
Testing important resistance levels that may determine its next significant move, the U.S. Dollar Index (DXY) has reached a critical juncture. Traders keep a careful eye on Elliott Wave patterns and Fibonacci retracement lines to predict if positive momentum will continue or a wider slump will develop.
Key Resistance and Market Reaction
The U.S. Dollar Index ($DXY) is challenging important Fibonacci retracement points at this crucial level. As traders assess any shifts in direction, the index’s movement is continuously tracked. According to technical analysis by XForceGlobal, the market is approaching a decision point that could significantly impact global financial trends.
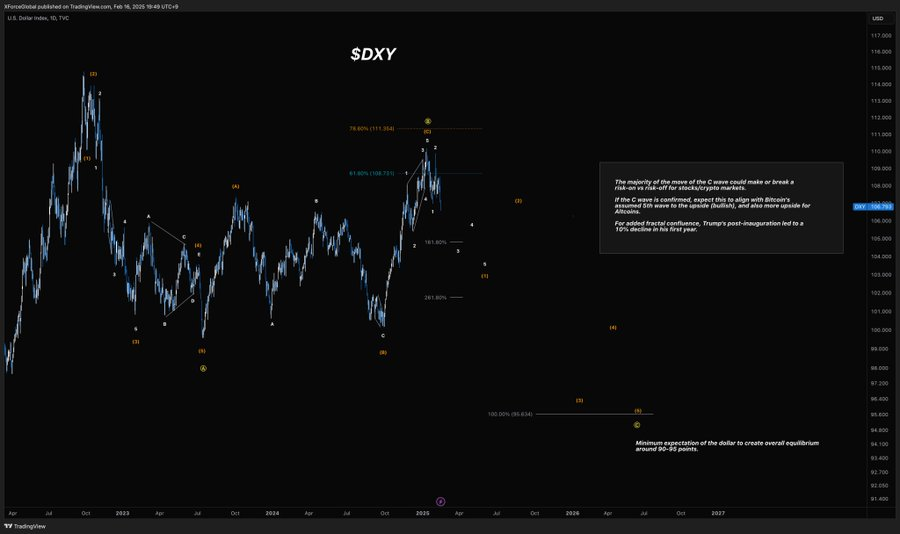
The 78.6% Fibonacci retracement level, a crucial resistance zone, has been reached by the price at 111.95. The retracement around 108.75, which is 61.8%, is another crucial reaction indicator. Analysts note that these Fibonacci levels have historically influenced market behavior and are closely monitored by traders assessing dollar strength.
Besides, a corrective “C” wave pattern is forming, indicating potential price shifts. If confirmed, historical trends suggest alignment with Bitcoin’s price movement. This connection reinforces broader macroeconomic trends impacting both fiat and digital assets.
Projected Decline and Support Levels
The timeframe outlines a five-wave downward trajectory, indicating possible bearish momentum. Wave (1) signals the initial downtrend, while wave (3) appears extended, suggesting continued selling pressure. Wave (5) is projected to complete at the 100% Fibonacci extension near 95.64, reinforcing a structured decline.
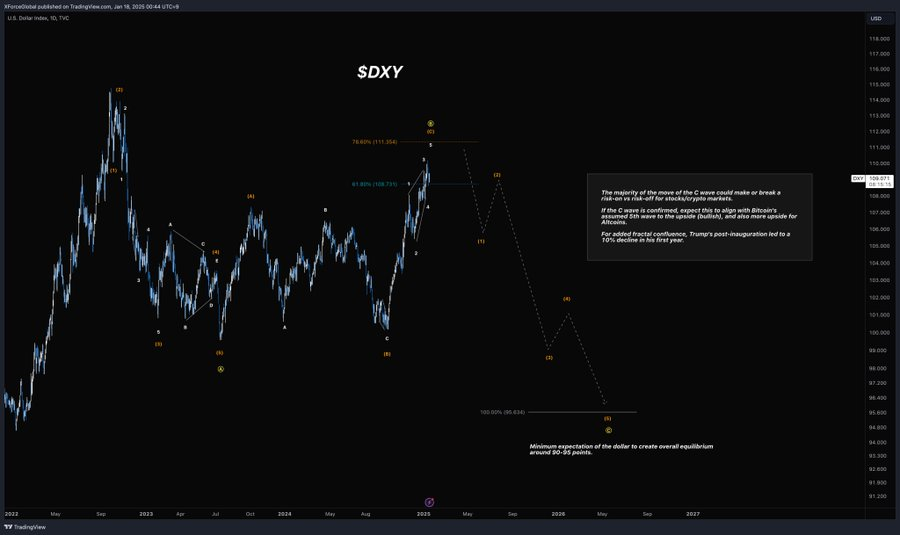
Moreover, historical fractal comparisons show a 10% dollar decline following Trump’s inauguration. If similar macroeconomic conditions persist, a downward trend could unfold. Analysts project that equilibrium levels could fall between 90 and 95 points, though further market developments will determine stabilization.
Market Outlook and Technical Considerations
Key decision zones are highlighted by additional technical indicators in addition to Fibonacci levels. Market analysts suggest that resistance levels often act as decision points where traders assess potential trend shifts. Increased volatility is still a possibility, which emphasizes how crucial market positioning is.
Furthermore, Analysts observe that wave counts and fractal correlations indicate a potential bearish trend, though confirmation depends on further price action. However, confirmation through price reactions at resistance levels is necessary. If the dollar fails to break higher, support tests may accelerate, aligning with projected wave structures.
Market participants are monitoring upcoming sessions for signs that may indicate the index’s next directional movement. Market participants remain attentive to confirm trend continuation or reversal signals. This analysis provides a structured outlook on future price action, incorporating historical comparisons and technical formations for a comprehensive market perspective.