- DOGE’s monthly chart forms a Doji candle, mirroring a design that preceded strong price movements in past cycles.
- Historical data shows similar Doji formations before Dogecoin experienced notable upward trends after the accumulation and consolidation phases.
- Analysts are observing whether Dogecoin’s current chart structure will follow previous cycles that resulted in substantial price shifts.
Dogecoin’s latest monthly chart has formed a Doji candle, reflecting a similar pattern from the previous cycle. This formation appeared before a significant price movement in past market trends. Analysts are examining whether this structure could lead to a major shift in Dogecoin’s trajectory. The current Doji mirrors its position in the 2017-2018 cycle when Dogecoin experienced a substantial increase in value.
Doji Formation in Dogecoin’s Chart
A Doji candle represents market uncertainty, appearing when opening and closing prices are nearly identical. This signal has historically preceded trend reversals or periods of strong momentum. Dogecoin’s chart structure now resembles a past cycle that led to a rapid price movement. Observers note that historical data suggests potential volatility following such formations.
According to market observation, a doji appeared before a significant price surge in 2017, following a consolidation phase. A similar pattern formed in 2024 after a rounded bottom and upward movement. The market experienced accumulation phases before breakouts, with bullish trends following each doji.
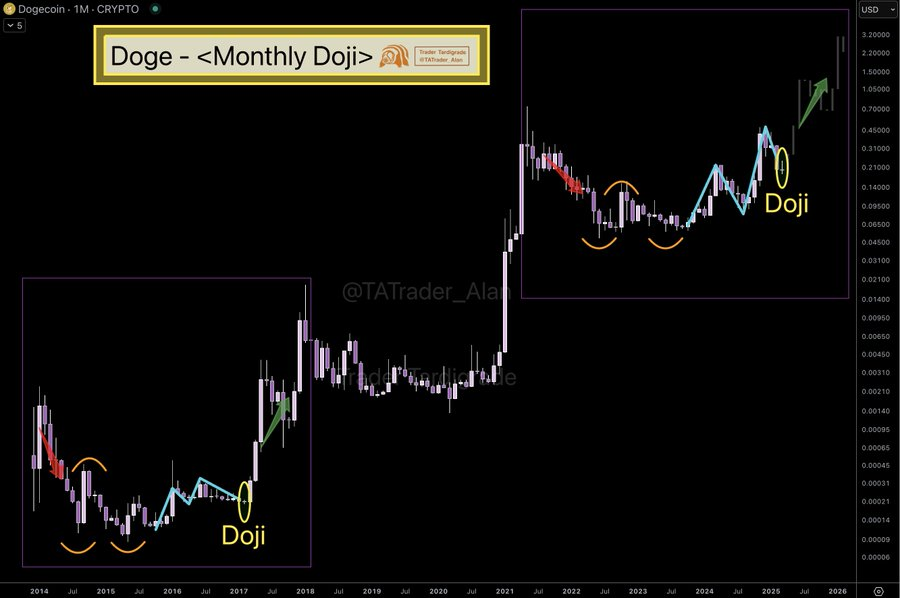
The chart also shows prior downtrends, recoveries, and breakout levels. Historical patterns indicate that doji candles appeared at reversal points before major upward trends. Green arrows indicate potential future upward movement following consolidation, mirroring previous breakout structures.
Market Conditions Align With Previous Patterns
During the 2017-2018 period, a similar Doji pattern on Dogecoin’s monthly chart was followed by an upward trend. Market participants are comparing past conditions to the current landscape. The similarities in technical patterns have drawn attention to Dogecoin’s market behavior. The coin’s price movement aligns with historical data that previously led to significant changes.
A Doji candle does not confirm future price action but marks a point of indecision in the market. Traders and analysts are monitoring whether Dogecoin will repeat its historical behavior. The current pattern has prompted discussions on whether the market will react in a similar manner.