
- Dogecoin’s URPD reveals minimal historical buying under current levels, indicating thin structural support and potential accelerated downward movement.
- The 12-hour symmetrical triangle pattern shows weak volume, confirming DOGE trades on fragile footing with limited buyer defense.
- Historical accumulation near $0.081 represents the next significant support cluster capable of absorbing strong sell pressure effectively.
Dogecoin $DOGE faces fragile support beneath its current price, suggesting a potential downward move toward stronger accumulation zones. On-chain data indicates limited buyer activity under current market levels.
Sparse Support Under Current Price
Dogecoin’s UTXO Realized Price Distribution (URPD) shows thin support beneath the present price. The URPD measures where holders last transacted, reflecting zones of structural and psychological support.
Most realized volume is clustered well below current levels, leaving few buyers defending the price.The data shows only low-density bars immediately below DOGE, indicating that a breakdown could accelerate downward momentum.
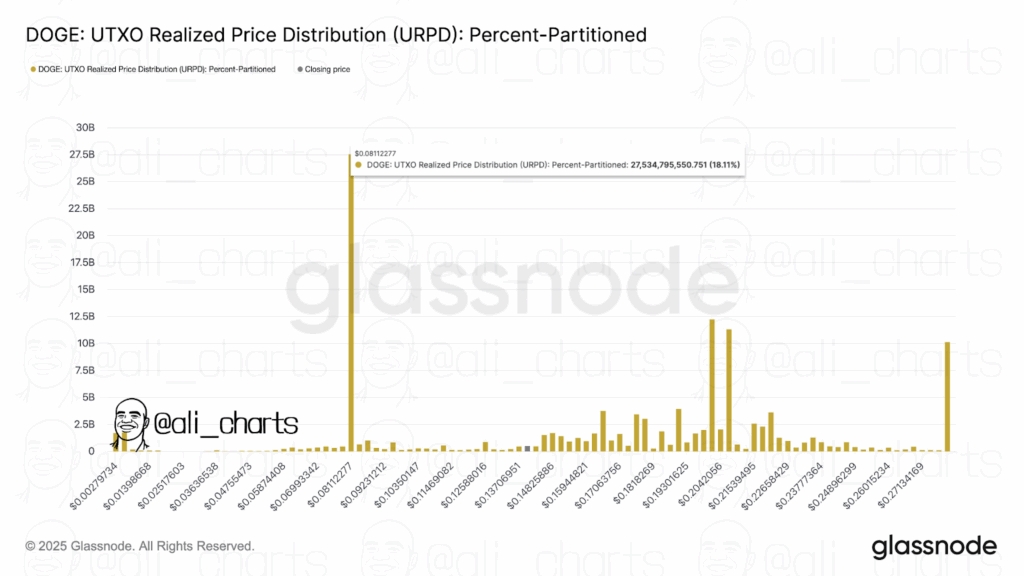
Sparse support zones allow sellers to push prices lower quickly due to the absence of significant buyer presence. The first notable accumulation cluster appears near $0.081, where historical volume is substantially higher.
This concentration near $0.081 reflects committed holder activity and could serve as the next major support if current levels fail. Until DOGE reaches this zone, price action remains exposed to rapid declines. Analysts suggest monitoring the thin support closely to assess potential risk.
Symmetrical Triangle Formation Signals Fragility
DOGE has formed a symmetrical triangle on the 12-hour chart. This pattern indicates a period of price compression within the current downtrend. Even though Dogecoin has bounced off the lower trendline a few times, trading volume remains low.
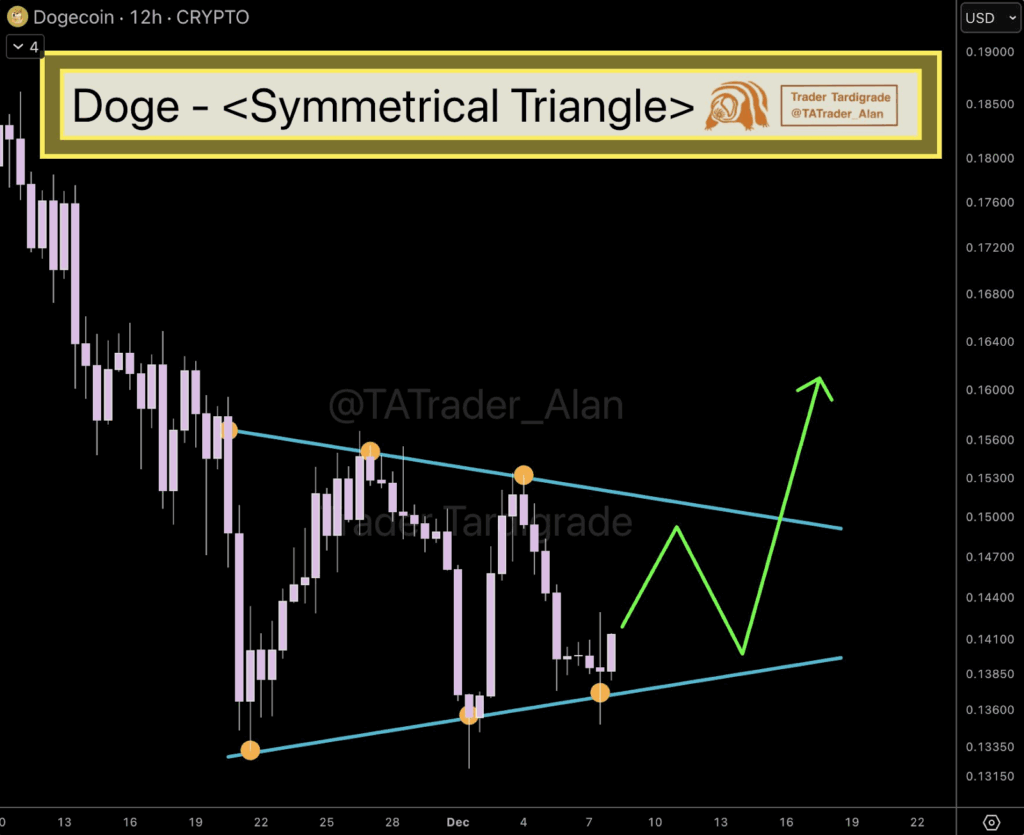
This shows buyers aren’t strongly defending current prices, leaving the market exposed.On-chain data confirms that little historical buying exists immediately below the triangle.
If DOGE breaches the lower boundary, it may accelerate toward the $0.081 support cluster.The triangle’s formation, combined with sparse structural support, suggests volatility could increase.
Traders are expecting a rapid downward movement if the pattern resolves to the downside. Market participants should note that the first meaningful support lies substantially lower.
Volatile Price Action Reflects Shallow Support
Recent DOGE market behavior shows repeated rebounds with sharp pullbacks, reflecting reactive rather than confident buying. Early December saw a brief dip in market cap, followed by a recovery lacking depth. These moves indicate that current levels are weakly defended.
Price spikes around December 6th and 7th further illustrate how thin support can result in sudden losses. The absence of concentrated holders at current levels allows small sell-offs to cascade into larger declines. Analysts point out that the next substantial buffer exists only near $0.081.
Traders monitoring Dogecoin should note the combination of technical patterns and on-chain data. With historical accumulation concentrated at lower levels, DOGE remains exposed to rapid movements until stronger buyer clusters emerge.