
Key Insights
- Dogecoin trades below $0.09 as declining Open interest and rising liquidations reflect stronger bearish positioning across derivatives markets and weakening trader confidence levels.
- Negative funding rates and a sub-one long-to-short ratio highlight sustained dominance of short sellers, reinforcing expectations of continued downside pressure in near-term trading.
- Technical indicators show mild bearish momentum as DOGE holds above key support, while resistance levels continue to limit recovery attempts amid cautious market conditions.
Dogecoin traded lower on Thursday, slipping under the $0.0900 level as broader market unease shaped sentiment. Consequently, renewed geopolitical concerns pushed oil prices higher, which reduced appetite for risk-driven assets. Besides, retail participation weakened, adding further pressure on the meme coin’s price action.
Market participants reacted cautiously to expectations of prolonged geopolitical tension, which influenced capital flows. Moreover, this shift pushed traders toward safer positions while reducing exposure to speculative tokens like DOGE.
Derivatives Data Signals Bearish Control
Derivatives metrics reflected growing downside expectations among traders. Open interest declined to $1.05 billion, marking a slight drop over the past day. Additionally, liquidations reached $4.55 million, with long positions accounting for the majority, which reinforced selling pressure.
The long-to-short ratio slipped below parity, indicating that short positions now dominate active trades. Significantly, the negative funding rate confirmed that traders continued to pay a premium to maintain bearish bets. Hence, this combination pointed to sustained risk-off sentiment across the derivatives market.
Technical Indicators Show Weak Momentum
Technical signals aligned with the broader cautious tone. Dogecoin remained under its 50-day Exponential Moving Average, which continued to slope downward. Moreover, the 100-day and 200-day averages reinforced a wider bearish structure.
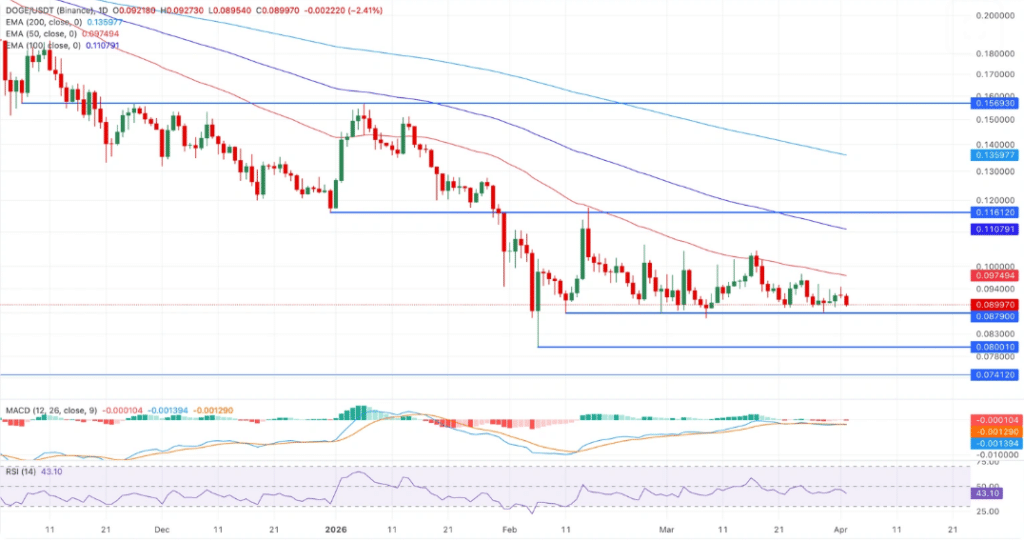
The Moving Average Convergence Divergence indicator showed limited downside strength as its histogram flattened near the zero line. However, the Relative Strength Index stayed below the midpoint, suggesting mild bearish momentum without entering oversold conditions. Consequently, price action retained room for further movement in either direction.
Price action hovered just above the $0.0879 support level, which traders closely monitored. A confirmed break below this zone could expose the $0.0800 level, previously tested in early February. Additionally, a deeper decline may bring the $0.0741 level back into focus.
On the upside, resistance remained firm near the 50-day and 100-day moving averages. These levels continued to limit recovery attempts as selling pressure persisted across sessions.
Market Structure Reflects Caution
Trading activity suggested a cautious approach among participants rather than aggressive selling. Volume patterns and indicator signals pointed to gradual pressure instead of sharp declines. Moreover, the balance between weak demand and steady resistance levels defined the current structure.